I am trying to place 3 density functions in plot using
plot(density(all_noise),xlim=c(-1,1),ylim=c(0,10))
lines(density(max_nearby),col="blue")
lines(density(max_repeats),col="red")
and I got
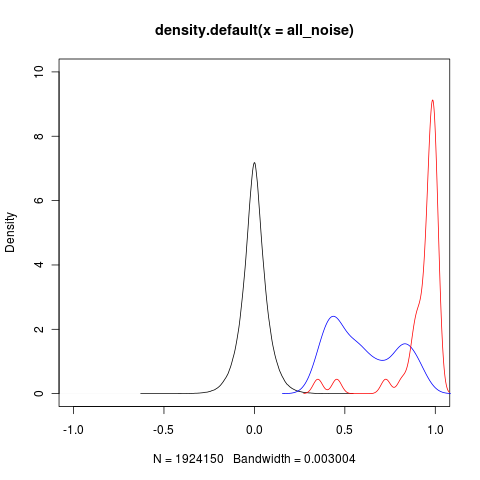
Shouldn't the density value on the y axis be < 1? Are there better methods for superimposing kernel distributions?
str(density(all_noise))
List of 7
$ x        : num [1:512] -0.629 -0.626 -0.624 -0.622 -0.62 ...
$ y        : num [1:512] 1.41e-06 8.22e-06 3.16e-05 7.85e-05 1.24e-04 ...
$ bw       : num 0.003
$ n        : int 1924150
$ call     : language density.default(x = all_noise)
$ data.name: chr "all_noise"
$ has.na   : logi FALSE
- attr(*, "class")= chr "density"

str(density(max_nearby))
List of 7
$ x        : num [1:512] 0.154 0.156 0.158 0.16 0.162 ...
$ y        : num [1:512] 0.00111 0.00125 0.0014 0.00157 0.00175 ...
$ bw       : num 0.0543
$ n        : int 250
$ call     : language density.default(x = max_nearby)
$ data.name: chr "max_nearby"
$ has.na   : logi FALSE
- attr(*, "class")= chr "density"

str(density(max_repeats ))
List of 7
$ x        : num [1:512] 0.272 0.274 0.275 0.277 0.279 ...
$ y        : num [1:512] 0.00507 0.00607 0.00722 0.00854 0.01011 ...
$ bw       : num 0.0261
$ n        : int 34
$ call     : language density.default(x = max_repeats)
$ data.name: chr "max_repeats"
$ has.na   : logi FALSE
- attr(*, "class")= chr "density"
The area under the density curves is 1, but they can exceed 1. I see nothing wrong with how you're doing this. For my own purposes about the only change I'd make would be to initialize the plot window with values so that all densities are in the bounds of the plot window.
Also, regarding the previous answer (I can't comment yet) notice that ylim is an argument to plot(), not to density() --- it's not telling density() to do anything.
If you love us? You can donate to us via Paypal or buy me a coffee so we can maintain and grow! Thank you!
Donate Us With

