Pine editor still does not have built-in functions to plot lines (such as support lines, trend lines). I could not find any direct or indirect method to draw lines. I want to build function that look like below (for example only)
draw_line(price1, time1,price2, time2)
any Ideas or suggestions ?
Unfortunately I don't think this is something they want to provide. Noticing several promising posts from 4 years ago that never came through. The only other way, seem to involve some calculations, by approximating your line with some line plots, where you hide the non-relevant parts.
For example:
...
c = close >= open ? lime : red
plot(close, color = c)
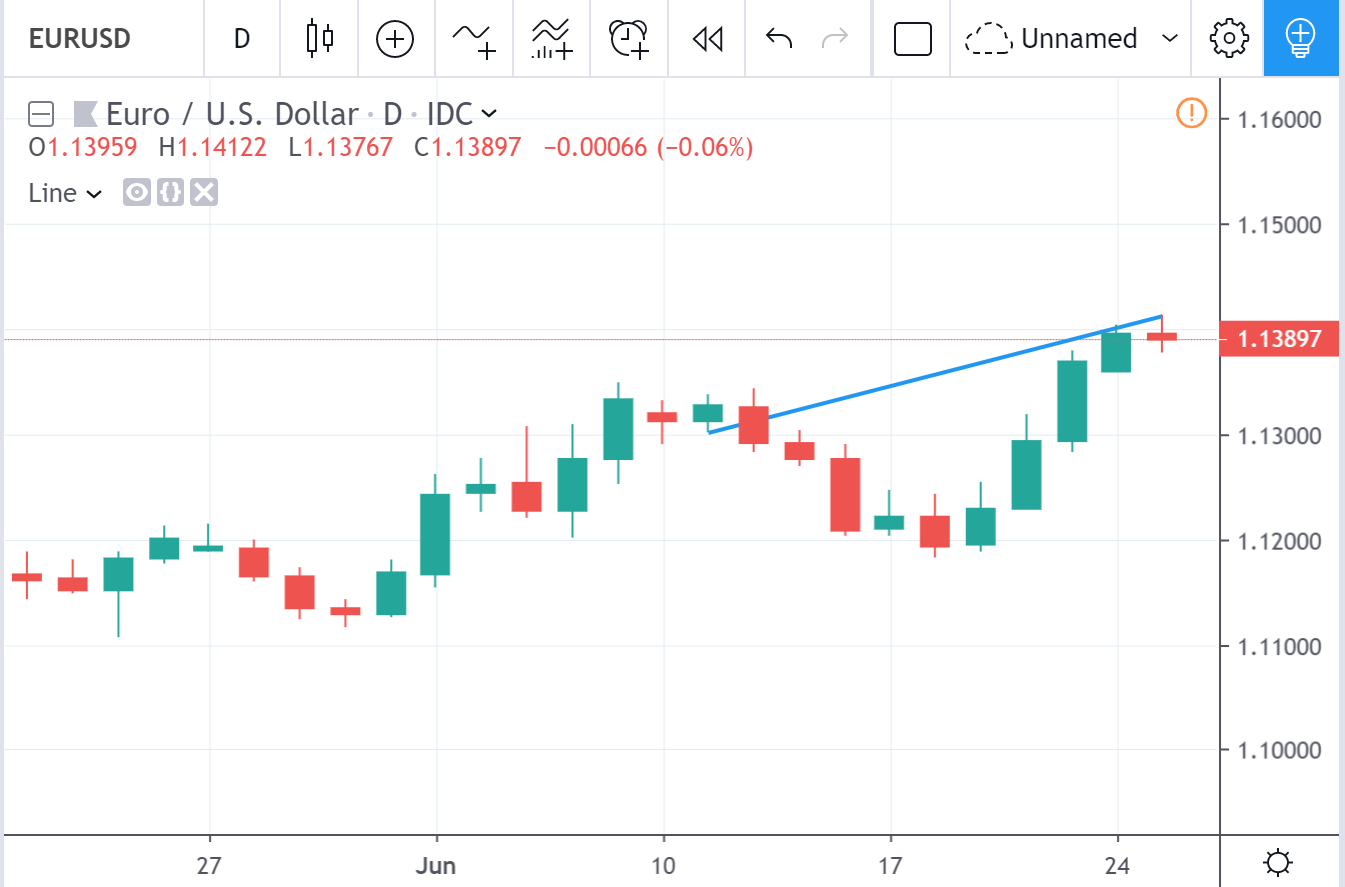
would produce something like this:

Then, you could try to replace red with na to get only the green parts.
Example 2
I've done some more experiments. Apparently Pine is so crippled you can't even put a plot in function, so the only way seem to be to use the point slope formula for a line, like this:
//@version=3
study(title="Simple Line", shorttitle='AB', overlay=true)

P1x = input(5744)
P1y = input(1.2727)
P2x = input(5774)
P2y = input(1.2628)
plot(n, color=na, style=line)   // hidden plot to show the bar number in indicator

// point slope
m = - (P2y - P1y) / (P2x - P1x)

// plot range
AB = n < P1x or n > P2x ? na : P1y - m*(n - P1x)
LA = (n == P1x) ? P1y : na
LB = (n == P2x) ? P2y : na

plot(AB, title="AB", color=#ff00ff, linewidth=1, style=line, transp=0)
plotshape(LA, title='A', location=location.absolute, color=silver, transp=0, text='A', textcolor=black, style=shape.labeldown)
plotshape(LB, title='B', location=location.absolute, color=silver, transp=0, text='B', textcolor=black, style=shape.labelup )
The result is quite nice, but too inconvenient to use.

UPDATE: 2019-10-01
Apparently they have added some new line functionality to Pinescript 4.0+.
Here is an example of using the new vline() function:
//@version=4
study("vline() Function for Pine Script v4.0+", overlay=true)

vline(BarIndex, Color, LineStyle, LineWidth) => // Verticle Line, 54 lines maximum allowable per indicator
    return = line.new(BarIndex, -1000, BarIndex, 1000, xloc.bar_index, extend.both, Color, LineStyle, LineWidth)

if(bar_index%10==0.0)
    vline(bar_index, #FF8000ff, line.style_solid, 1) // Variable assignment not required
As for the other "new" line function, I have not tested it yet.
This is now possible in Pine Script v4:
//@version=4
study("Line", overlay=true)
l = line.new(bar_index, high, bar_index[10], low[10], width = 4)
line.delete(l[1])
Here is a vertical line function by midtownsk8rguy on TradingView:
vline(BarIndex, Color, LineStyle, LineWidth) => // Verticle Line Function, ≈50-54 lines maximum allowable per indicator
    // return = line.new(BarIndex,   0.0, BarIndex,     100.0, xloc.bar_index, extend.both, Color, LineStyle, LineWidth) // Suitable for study(overlay=false) and RSI, Stochastic, etc...
    // return = line.new(BarIndex,  -1.0, BarIndex,       1.0, xloc.bar_index, extend.both, Color, LineStyle, LineWidth) // Suitable for study(overlay=false) and +/-1.0 oscillators
    return = line.new(BarIndex, low - tr, BarIndex, high + tr, xloc.bar_index, extend.both, Color, LineStyle, LineWidth) // Suitable for study(overlay=true)

if(bar_index%10==0.0) // Generically plots a line every 10 bars
    vline(bar_index, #FF8000ff, line.style_solid, 1) // Variable assignment not required
You can also use if barstate.islast if you only draw your lines once instead of on each candle, this way you don't need to delete the previous lines.
More compact code for draw lines:
//@version=3
study("Draw line", overlay=true)

plot(n, color=na, style=line)
AB(x1,x2,y1,y2) => n < x1 or n > x2 ? na : y1 + (y2 - y1) / (x2 - x1) * (n - x1)

plot(AB(10065,10136,3819,3893), color=#ff00ff, linewidth=1, style=line,
transp=0)
plot(AB(10091,10136,3966.5,3931), color=#ff00ff, linewidth=1, style=line,
transp=0)
If you love us? You can donate to us via Paypal or buy me a coffee so we can maintain and grow! Thank you!
Donate Us With


