I apologize for being a bit verbose in advance: if you want to skip all the background mumbo jumbo you can see my question down below.
This is pretty much a follow up to a question I previously posted on how to compare two 1D (time dependent) signals. One of the answers I got was to use the cross-correlation function (xcorr in MATLAB), which I did.
Perhaps a little background information will be useful: I'm trying to implement an Independent Component Analysis algorithm. One of my informal tests is to (1) create the test case by (a) generate 2 random vectors (1x1000), (b) combine the vectors into a 2x1000 matrix (called "S"), and multiply this by a 2x2 mixing matrix (called "A"), to give me a new matrix (let's call it "T").
In summary: T = A * S
(2) I then run the ICA algorithm to generate the inverse of the mixing matrix (called "W"), (3) multiply "T" by "W" to (hopefully) give me a reconstruction of the original signal matrix (called "X")
In summary: X = W * T
(4) I now want to compare "S" and "X". Although "S" and "X" are 2x1000, I simply compare S(1,:) to X(1,:) and S(2,:) to X(2,:), each which is 1x1000, making them 1D signals. (I have another step which makes sure that these vectors are the proper vectors to compare to each other and I also normalize the signals).
So my current quandary is how to 'grade' how close S(1,:) matches to X(1,:), and likewise with S(2,:) to X(2,:).
So far I have used something like: r1 = max(abs(xcorr(S(1,:), X(1,:)))
Assuming that using the cross correlation function is a valid way to go about comparing the similarity of two signals, what would be considered a good R value to grade the similarity of the signals? Wikipedia states that this is a very subjective area, and so I defer to the better judgment of those who might have experience in this field.
As you might realize, I'm not coming from a EE/DSP/statistical background at all (I'm a medical student) so I'm going through a sort of "baptism through fire" right now, and I appreciate all the help I can get. Thanks!
(edit: as far as directly answering your question about R values, see below)
One way to approach this would be to use cross-correlation. Bear in mind that you have to normalize amplitudes and correct for delays: if you have signal S1, and signal S2 is identical in shape, but half the amplitude and delayed by 3 samples, they're still perfectly correlated.
For example:
>> t = 0:0.001:1;
>> y = @(t) sin(10*t).*exp(-10*t).*(t > 0);
>> S1 = y(t);
>> S2 = 0.4*y(t-0.1);
>> plot(t,S1,t,S2);
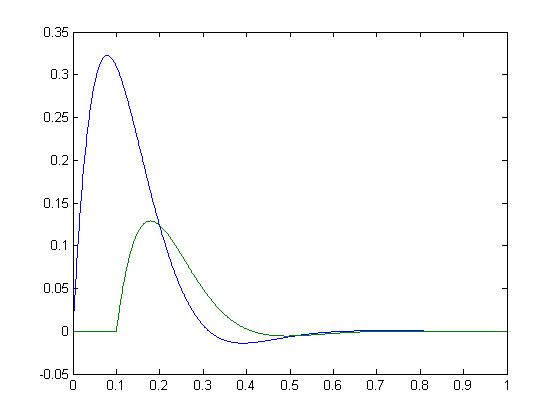
These should have a perfect correlation coefficient. A way to compute this is to use maximum cross-correlation:
>> f = @(S1,S2) max(xcorr(S1,S2));

f =

    @(S1,S2) max(xcorr(S1,S2))

>>  disp(f(S1,S1)); disp(f(S2,S2)); disp(f(S1,S2));
   12.5000

    2.0000

    5.0000
The maximum value of xcorr() takes care of the time-delay between signals. As far as correcting for amplitude goes, you can normalize the signals so that their self-cross-correlation is 1.0, or you can fold that equivalent step into the following:
ρ2 = f(S1,S2)2 / (f(S1,S1)*f(S2,S2);
In this case ρ2 = 5 * 5 / (12.5 * 2) = 1.0
You can solve for ρ itself, i.e. ρ = f(S1,S2)/sqrt(f(S1,S1)*f(S2,S2)), just bear in mind that both 1.0 and -1.0 are perfectly correlated (-1.0 has opposite sign)
Try it on your signals!
with respect to what threshold to use for acceptance/rejection, that really depends on what kind of signals you have. 0.9 and above is fairly good but can be misleading. I would consider looking at the residual signal you get after you subtract out the correlated version. You could do this by looking at the time index of the maximum value of xcorr():
>> t = 0:0.001:1;
>> y = @(a,t) sin(a*t).*exp(-a*t).*(t > 0);
>> S1=y(10,t);
>> S2=0.4*y(9,t-0.1);
>> f(S1,S2)/sqrt(f(S1,S1)*f(S2,S2))

ans =

    0.9959
This looks pretty darn good for a correlation. But let's try fitting S2 with a scaled/shifted multiple of S1:
>> [A,i]=max(xcorr(S1,S2)); tshift = i-length(S1);
>> S2fit = zeros(size(S2)); S2fit(1-tshift:end) = A/f(S1,S1)*S1(1:end+tshift);
>> plot(t,[S2; S2fit]); % fit S2 using S1 as a basis

>> plot(t,[S2-S2fit]); % residual

Residual has some energy in it; to get a feel for how much, you can use this:
>> S2res=S2-S2fit;
>> dot(S2res,S2res)/dot(S2,S2)

ans =

    0.0081

>> sqrt(dot(S2res,S2res)/dot(S2,S2))

ans =

    0.0900
This says that the residual has about 0.81% of the energy (9% of the root-mean-square amplitude) of the original signal S2. (the dot product of a 1D signal with itself will always be equal to the maximum value of cross-correlation of that signal with itself.)
I don't think there's a silver bullet for answering how similar two signals are with each other, but hopefully I've given you some ideas that might be applicable to your circumstances.
A good starting point is to get a sense of what a perfect match will look like by calculating the auto-correlations for each signal (i.e. do the "cross-correlation" of each signal with itself).
THIS IS A COMPLETE GUESS - but I'm guessing max(abs(xcorr(S(1,:),X(1,:)))) > 0.8 implies success. Just out of curiosity, what kind of values do you get for max(abs(xcorr(S(1,:),X(2,:))))?
Another approach to validate your algorithm might be to compare A and W. If W is calculated correctly, it should be A^-1, so can you calculate a measure like |A*W - I|? Maybe you have to normalize by the trace of A*W.
Getting back to your original question, I come from a DSP background, so I get to deal with fairly noise-free signals. I understand that's not a luxury you get in biology :) so my 0.8 guess might be very optimistic. Perhaps looking at some literature in your field, even if they aren't using cross-correlation exactly, might be useful.
If you love us? You can donate to us via Paypal or buy me a coffee so we can maintain and grow! Thank you!
Donate Us With


