Consider the following R code to produce a choropleth map in plotly:
#devtools::install_github("ropensci/plotly")
library(plotly)

df <- read.csv('https://raw.githubusercontent.com/plotly/datasets/master/2014_world_gdp_with_codes.csv')

# light grey boundaries
l <- list(color = toRGB("grey"), width = 0.5)

# specify map projection/options
g <- list(
  showframe = FALSE,
  showcoastlines = FALSE,
  projection = list(type = 'Mercator')
)

plot_ly(df, z = GDP..BILLIONS., text = COUNTRY, locations = CODE, type = 'choropleth',
        color = GDP..BILLIONS., colors = 'Blues', marker = list(line = l),
        colorbar = list(tickprefix = '$', title = 'GDP Billions US$'),
        filename="r-docs/world-choropleth") %>%
  layout(title = '2014 Global GDP<br>Source:<a href="https://www.cia.gov/library/publications/the-world-factbook/fields/2195.html">CIA World Factbook</a>',
         geo = g)
Is there a plotly build-in option to display country names on the map? If not, what would be a smart way of coding this?
To view the example: https://plot.ly/r/choropleth-maps/
Installation instructions for plotly: https://plot.ly/r/getting-started/
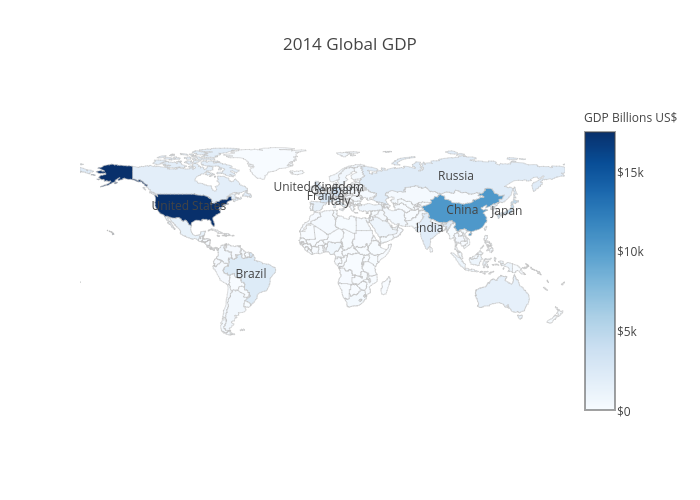
You can show country labels by adding a new scattergeo trace with mode set to "text" to just show the labels.
Here is an example. I'm using dplyr to filter out the 10 greatest rows.
df <- read.csv('https://raw.githubusercontent.com/plotly/datasets/master/2014_world_gdp_with_codes.csv')

# light grey boundaries
l <- list(color = toRGB("grey"), width = 0.5)

# specify map projection/options
g <- list(
  showframe = FALSE,
  showcoastlines = FALSE,
  projection = list(type = 'Mercator')
)

p <- (plot_ly(df, z = GDP..BILLIONS., text = COUNTRY, locations = CODE, type = 'choropleth',
        color = GDP..BILLIONS., colors = 'Blues', marker = list(line = l),
        colorbar = list(tickprefix = '$', title = 'GDP Billions US$'),
        inherit = FALSE, # don't pass arguments into the next trace
        filename="r-docs/choropleth-with-country-labels") %>%
  layout(title = '2014 Global GDP',
         geo = g) %>%
  dplyr::arrange(dplyr::desc(GDP..BILLIONS.)))[seq(1, 10), ] %>%
  add_trace(type="scattergeo", # view all scattergeo properties here: https://plot.ly/r/reference/#scattergeo
            locations = CODE, text = COUNTRY, mode="text")
full screen, interactive version
If you love us? You can donate to us via Paypal or buy me a coffee so we can maintain and grow! Thank you!
Donate Us With