I'm trying to make a annotated heatmap on plotly.
import plotly.plotly as py
import plotly.tools as tls
from plotly.graph_objs import *
import numpy as np
import pandas as pd
import matplotlib.pyplot as plt

df = pd.read_csv('masterc.csv')

locations = {}
anno = []

for i in range(df.shape[0]):
    locations.setdefault((df.iat[i,2],df.iat[i,6]),0)
    locations[(df.iat[i,2],df.iat[i,6])]+=df.iat[i,8]

x1 = []
y1 = []
z1 = []
z1_text = []

for key in locations.keys():
    if key[0] not in x1:
        x1 += [key[0],]
    if key[1] not in y1:
        y1 += [key[1],]


for y in y1:
    dummy = []
    for x in x1:
        if (x,y) in locations.keys():
            dummy += [locations[(x,y)],]
        else:
            dummy += [0,]
    z1 += [dummy,]

data = z1

arr = np.array(data)

fig, ax = plt.subplots()

ax.imshow(data, cmap='seismic')

for (i, j), z in np.ndenumerate(data):
    ax.text(j, i, '{:f}'.format(z), ha='center', va='center')

ax.set_xticklabels(x1, rotation=90)
ax.set_yticklabels(y1)

#plt.show()
py.plot_mpl(fig)
I'm getting the following warning
Warning (from warnings module):
  File "C:\Python27\lib\site-packages\plotly\matplotlylib\renderer.py", line 394
    warnings.warn("Aw. Snap! You're gonna have to hold off on "
UserWarning: Aw. Snap! You're gonna have to hold off on the selfies for now. Plotly can't import images from matplotlib yet!
and finally the following error
Traceback (most recent call last):
  File "E:\Project Kumbh\heatmap with annotations.py", line 58, in <module>
    py.plot_mpl(fig)
  File "C:\Python27\lib\site-packages\plotly\plotly\plotly.py", line 261, in plot_mpl
    return plot(fig, **plot_options)
  File "C:\Python27\lib\site-packages\plotly\plotly\plotly.py", line 155, in plot
    figure = tools.return_figure_from_figure_or_data(figure_or_data, validate)
  File "C:\Python27\lib\site-packages\plotly\tools.py", line 1409, in return_figure_from_figure_or_data
    if not figure['data']:
KeyError: 'data'
Is there anyway to get around this error? Or is there any simple way to make an annotated heatmap on plotly?
Edit
It's now possible to do it easily with plotly.figure_factory:
https://plot.ly/python/annotated_heatmap/
As far as I know, it is still not possible to convert Matplotlib's heatmaps into Plotly's though.
Aug 2015 Answer
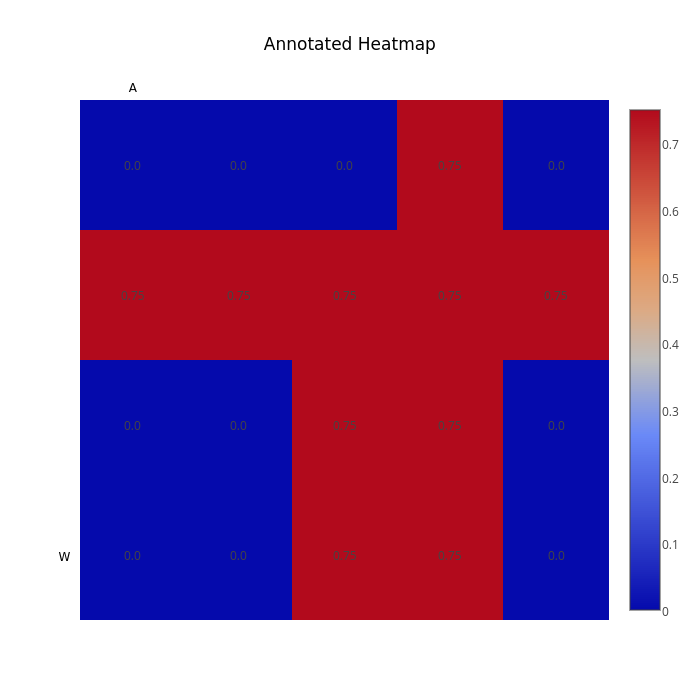
Here's an example of making an annotated heatmap with the python api:
import plotly.plotly as py
import plotly.graph_objs as go

x = ['A', 'B', 'C', 'D', 'E']
y = ['W', 'X', 'Y', 'Z']

#       x0    x1    x2    x3    x4
z = [[0.00, 0.00, 0.75, 0.75, 0.00],  # y0
     [0.00, 0.00, 0.75, 0.75, 0.00],  # y1
     [0.75, 0.75, 0.75, 0.75, 0.75],  # y2
     [0.00, 0.00, 0.00, 0.75, 0.00]]  # y3

annotations = go.Annotations()
for n, row in enumerate(z):
    for m, val in enumerate(row):
        annotations.append(go.Annotation(text=str(z[n][m]), x=x[m], y=y[n],
                                         xref='x1', yref='y1', showarrow=False))

colorscale = [[0, '#3D9970'], [1, '#001f3f']]  # custom colorscale
trace = go.Heatmap(x=x, y=y, z=z, colorscale=colorscale, showscale=False)

fig = go.Figure(data=go.Data([trace]))
fig['layout'].update(
    title="Annotated Heatmap",
    annotations=annotations,
    xaxis=go.XAxis(ticks='', side='top'),
    yaxis=go.YAxis(ticks='', ticksuffix='  '),  # ticksuffix is a workaround to add a bit of padding
    width=700,
    height=700,
    autosize=False
)
print py.plot(fig, filename='Stack Overflow 31756636', auto_open=False)  # https://plot.ly/~theengineear/5179
With the result at https://plot.ly/~theengineear/5179
Linking a related GitHub issue: https://github.com/plotly/python-api/issues/273
If you love us? You can donate to us via Paypal or buy me a coffee so we can maintain and grow! Thank you!
Donate Us With