What good profilers do you know?
What is a good way to measure and tweak the performance of a C++ MFC application?
Is Analysis of algorithms really neccesary? http://en.wikipedia.org/wiki/Algorithm_analysis
I strongly recommend AQTime if you are staying on the Windows platform. It comes with a load of profilers, including static code analysis, and works with most important Windows compilers and systems, including Visual C++, .NET, Delphi, Borland C++, Intel C++ and even gcc. And it integrates into Visual Studio, but can also be used standalone. I love it.
If you're (still) using Visual C++ 6.0, I suggest using the built-in profiler. For more recent versions you could try Compuware DevPartner Performance Analysis Community Edition.
For Windows, check out Xperf which ships free with the Windows SDK. It uses sampled profile, has some useful UI, & does not require instrumentation. Quite useful for tracking down performance problems. You can answer questions like:
Who is using the most CPU? Drill down to function name using call stacks. Who is allocating the most memory? Who is doing the most registry queries? Disk writes? etc. You will be quite surprised when you find the bottlenecks, as they are probably not where you expected!
It's been a while since I profiled unmanaged code, but when I did I had good results with Intel's vtune. I'm sure somebody else will tell us if that's been overtaken.
Algorithmic analysis has the potential to improve your performance more profoundly than anything you'll find with a profiler, but only for certain classes of application. If you operate over reasonably large sets of data, algorithmic analysis might find ways to be more efficient in CPU/Memory/both, but if your app is mainly form-fill with a relational database for storage, it might not offer you much.
Intel Thread Checker via Vtune performance analyzer- Check this picture for the view i use the most that tells me which function eats up the most of my time.
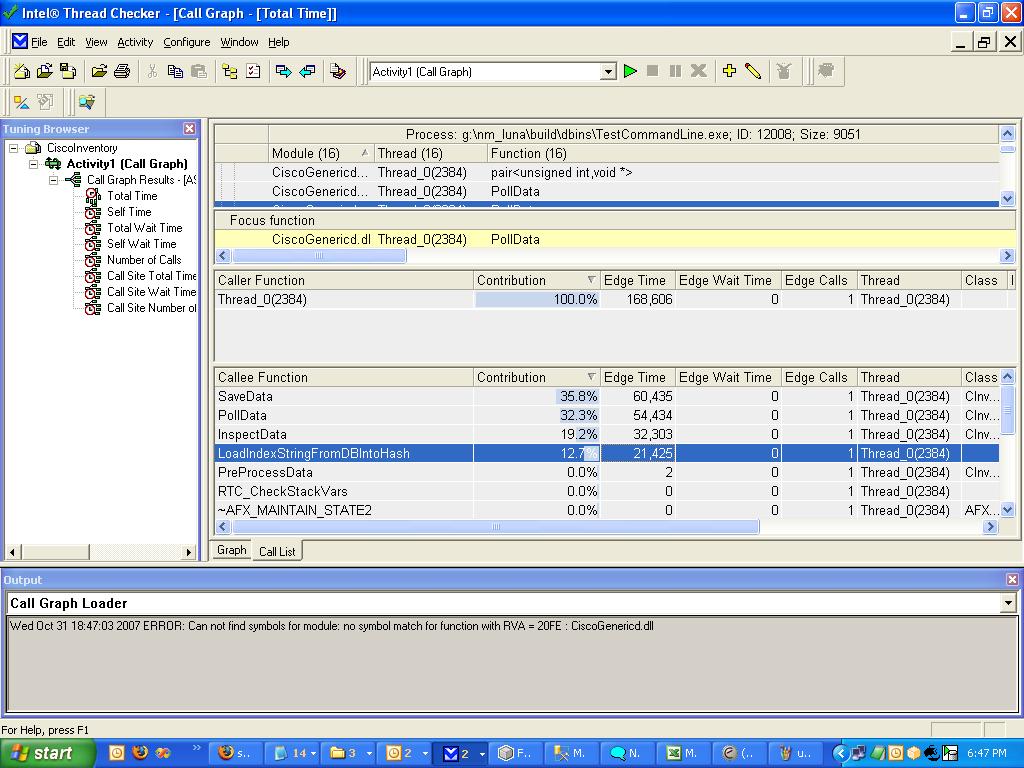
I can further drill down inside and decompose which functions inside them eats up more time etc. There are different views based on what you are watching (total time = time within fn + children), self time (time spent only in code running inside the function etc).
This tool does a lot more than profiling but i haven't explored them all. I would definitely recommend it. The tool is also available for downloading as a fully functional trial version that can run for 30 days. If you have cost constraints, i would say this window is all that you require to pin point your problem.
Trial download here - https://registrationcenter.intel.com/RegCenter/AutoGen.aspx?ProductID=907&AccountID=&ProgramID=&RequestDt=&rm=EVAL&lang=
ps : I have also played with Rational Rational but for some reason I did not take much to it. I suspect Rational might be more expensive than Intel too.
If you love us? You can donate to us via Paypal or buy me a coffee so we can maintain and grow! Thank you!
Donate Us With


