If you have ever asked how can I debug releasing/alloc issues in objective-c, you will have came across these environment settings that can help track the problem down:
NSZombieEnabled - Keeps abjects around after release, so you can get pointers etc.MallocStackLogging - keeps object history for reference later NSDebugEnabledYou set all of these to YES in the 'environment' section of the 'arguments' tab in the 'executables' (found in group tree) info.
So, Im getting this console output
MyApp [4413:40b] -[CALayer retainCount]: message sent to deallocated instance 0x4dbb170
then open terminal, while the debugger has forwarded the break and type:
malloc_history 4413 0x4dbb170
Then, I get a big text dump, and as far as I understand the important bit is this:
1
ALLOC 0x4dbb160-0x4dbb171 [size=18]:
thread_a0375540 |start | main |
UIApplicationMain | GSEventRun |
GSEventRunModal | CFRunLoopRunInMode |
CFRunLoopRunSpecific | __CFRunLoopRun
| __CFRunLoopDoTimer |
__CFRUNLOOP_IS_CALLING_OUT_TO_A_TIMER_CALLBACK_FUNCTION__
| __NSFireDelayedPerform |
-[todoListViewController drillDocumentMenu:] |
-[documentListViewController drillIntoDocumentWithToDoRecord:] |
-[documentViewController OpenTodoDocument:OfType:WithPath:] |
-[documentViewController OpenDocumentOfType:WithPath:] |
-[documentViewController managePDFDocumentWithPath:] |
-[PDFDocument loadPDFDocumentWithPath:andTitle:] |
-[PDFDocument getMetaData] | CGPDFDictionaryApplyFunction |
ListDictionaryObjects(char const*,
CGPDFObject*, void*) | NSLog | NSLogv
| _CFLogvEx | __CFLogCString |
asl_send | _asl_send_level_message |
asl_set_query | strdup | malloc |
malloc_zone_malloc
2
FREE  0x4dbb160-0x4dbb171 [size=18]:
thread_a0375540 |start | main |
UIApplicationMain | GSEventRun |
GSEventRunModal | CFRunLoopRunInMode |
CFRunLoopRunSpecific | __CFRunLoopRun
| __CFRunLoopDoTimer |
__CFRUNLOOP_IS_CALLING_OUT_TO_A_TIMER_CALLBACK_FUNCTION__
| __NSFireDelayedPerform |
-[todoListViewController drillDocumentMenu:] |
-[documentListViewController drillIntoDocumentWithToDoRecord:] |
-[documentViewController OpenTodoDocument:OfType:WithPath:] |
-[documentViewController OpenDocumentOfType:WithPath:] |
-[documentViewController managePDFDocumentWithPath:] |
-[PDFDocument loadPDFDocumentWithPath:andTitle:] |
-[PDFDocument getMetaData] | CGPDFDictionaryApplyFunction |
ListDictionaryObjects(char const*,
CGPDFObject*, void*) | NSLog | NSLogv
| _CFLogvEx | __CFLogCString |
asl_send | _asl_send_level_message |
asl_free | free
3
ALLOC 0x4dbb170-0x4dbb19f [size=48]:
thread_a0375540 |start | main |
UIApplicationMain | GSEventRun |
GSEventRunModal | CFRunLoopRunInMode |
CFRunLoopRunSpecific | __CFRunLoopRun
| __CFRunLoopDoTimer |
__CFRUNLOOP_IS_CALLING_OUT_TO_A_TIMER_CALLBACK_FUNCTION__
| __NSFireDelayedPerform |
-[todoListViewController drillDocumentMenu:] |
-[documentListViewController drillIntoDocumentWithToDoRecord:] |
-[documentViewController OpenTodoDocument:OfType:WithPath:] |
-[documentViewController OpenDocumentOfType:WithPath:] |
-[documentViewController managePDFDocumentWithPath:] |
-[ScrollViewWithPagingViewController init] | -[UIView init] |
-[UIScrollView initWithFrame:] | -[UIView initWithFrame:] | UIViewCommonInitWithFrame | -[UIView
_createLayerWithFrame:] | +[NSObject(NSObject) alloc] | +[NSObject(NSObject) allocWithZone:] | class_createInstance |
_internal_class_createInstanceFromZone | calloc | malloc_zone_calloc
What i don't understand though is if it the history was ALLOC,FREE,ALLOC then why does the error indicate that it was released (net +1 alloc)?
or is my understanding of the dump wrong?
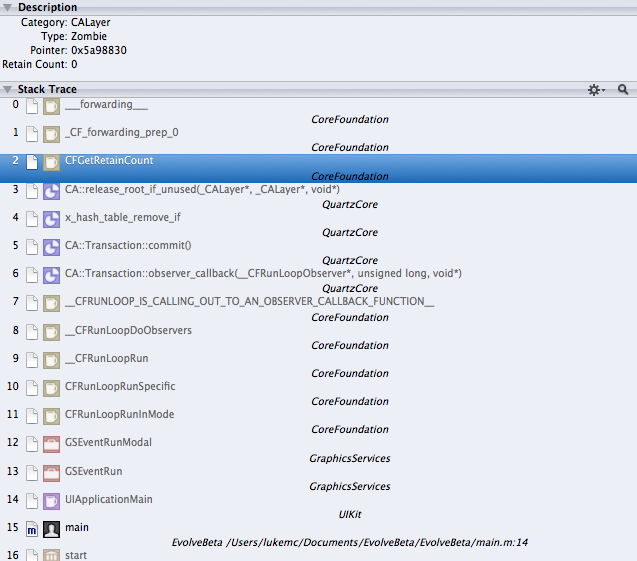
Zombie Detection with instruments:

Why and how, does the retain count jump from 1 to -1?
Looking at the backtrace of the Zombie, looks like the retain count is being called by: Quartz through release_root_if_unused

Edit: Solved- I was removing a view from super, then releasing it. Fixed by just releasing it.
@Kay is correct; the malloc history is showing two allocations at the specified address; one that has been allocated and freed and one that is still in play.
What you need is the backtrace of the call to retainCount on the CALayer that has already been released. Because you have zombie detection enabled, amongst other memory debugging things, it may be that the deallocation simply has not & will not happen.
Mixing malloc history with zombie detection changes the runtime behavior significantly.
I'd suggest running with zombie detection in Instruments. Hopefully, that'll pinpoint the exact problem.
If not, then there is a breakpoint you can set to break when a zombie is messaged. Set that breakpoint and see where you stop.
OK -- so, CoreAnimation is using the retain count for internal purposes (the system frameworks can get away with this, fragile though it is).
I think the -1 is a red herring; it is likely that zombies return 0xFF....FFFF as the retain count and this is rendered as -1 in Instruments.
Next best guess; since this is happening in a timer, the over-release is probably happening during animation. The CoreAnimation layers should handle this correctly. There is an over-release of a view or animation layer container in your code that is causing the layer to go away prematurely.
Have you tried "Build and Analyze"? Off-chance it might catch the mismanagement of a view somewhere.
In any case and as an experiment, try retaining your view(s) an extra time and see if that makes this problem stop. If it does, that is, at least, a clue.
(Or it might be a bug in the system frameworks... maybe... but doubtful.)
Finally, who the heck is calling retainCount?!?!? In the case of CoreAnimation, it is possible that the retainCount is being used internally as an implementation detail.
If it is your code, though, then the location of the zombie call should be pretty apparent.
If you love us? You can donate to us via Paypal or buy me a coffee so we can maintain and grow! Thank you!
Donate Us With