Folks,
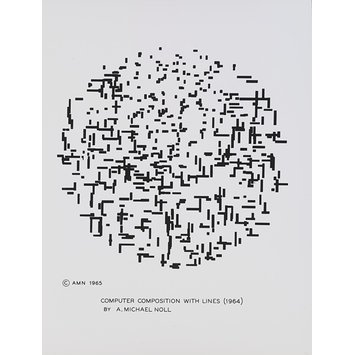
I am trying to reproduce a famous computer art work, "Computer Composition with Lines", by A. Michael Noll, in R using ggplot.
Here is the original: https://collections.vam.ac.uk/item/O1193787/computer-composition-with-lines-photograph-noll-a-michael/
I made it to the point where I can create a circle of randomly black or white pixels, but I have a hard time in creating patterns similar to the ones used by Noll.
I can easily create a matrix of ones and zeroes, then cut away the parts that are out of a circle. But the pattern (I tried uniform, beta, normal...) is definitely too similar to white noise, while there is a structure in the randomness of the original work.
library(tidyverse)

# this generates the matrix
genData <- function(N) {

  # a N*N matrix of ones and zero according to a rounded beta draw
  df <- tibble(x = rep(seq(1,N), N),
         y = rep(seq(1,N), each = N),
         z = round(rbeta(N*N, 2, 1)))

  # centering on zero and cutting away all points outside of a circle
  df %>%
    mutate(x = x-(N/2 + 1), y = y-(N/2 + 1)) %>%
    filter(x^2 + y^2 < (N/2)^2)
}

#this plots the data
plotData <- function(df, color = "black"){
  df %>%
    ggplot(aes(x,y, fill = as.factor(z)))+
    geom_tile()+
    scale_fill_manual(values = c(color, "white"))+
    coord_equal()+
    theme_void()+
    theme(legend.position = "none")
}

#executing
genData(100) %>%
  plotData()
Which results in:

I suppose the question boils down to which random process can I use here? I did not find any lead online.
I think this gets you a bit closer. I've also shortened the code by making use of geom_segment, which allows lengths to be drawn from a Poisson distribution.
It includes some logic to make the lines in the top section shorter.
If you try this with different random seeds you will probably find something you are happy with:
draw_picture <- function(seed = 1, density = 1, length = 2,
                         col = "black", bg = "gray90")
{
  set.seed(seed)

  x <- sample(100, 600 * density, TRUE) - 50
  y <- sample(100, 600 * density, TRUE) - 50
  ss <- which(sqrt(x^2 + y^2) < 50)
  x <- x[ss]
  y <- y[ss]
  orient <- sample(2, length(x), TRUE)

  lambda <- abs(ifelse(y > 0, length - 2/3 * length * abs(atan(y/x)), length))
  lens <- rpois(length(x), lambda) + 1
  end_x <- (orient %% 2) * lens + x
  end_y <- (orient - 1) * lens + y
  df <- data.frame(x, y, end_x, end_y)

  ggplot(df, aes(x, y)) +
    geom_segment(aes(xend = end_x, yend = end_y), color = col, size = 2) +
    coord_equal() +
    theme_void() +
    theme(panel.background = element_rect(fill = bg, color = NA))
}
So you can do:
draw_picture(8)

Or customize it with the parameters:
draw_picture(2020, density = 0.9, length = 5, col = "#567AFF", bg = "#2345A0")

If you love us? You can donate to us via Paypal or buy me a coffee so we can maintain and grow! Thank you!
Donate Us With