I'm having multiple data frames where the first column (in the end filled with NA's) is the wavenumber and the other columns are my variables of the specific wavenumber for multiple observations.
Is there a possibility to plot the columns in a way that my first column holds the variables for the x-axis and the other are plotted into one big plot with their respective y-values?
I already tried "matplot" (resulting in "numbers" instead of points),
matplot(df[,1],df[,3:5],xlab = "Wavelength [nm]", ylab = "Absorbance")
different sets of "xyplot" (no possibility to give more than one y-value), but none seem to work (on my level of knowledge on R).
The final result should look like this:
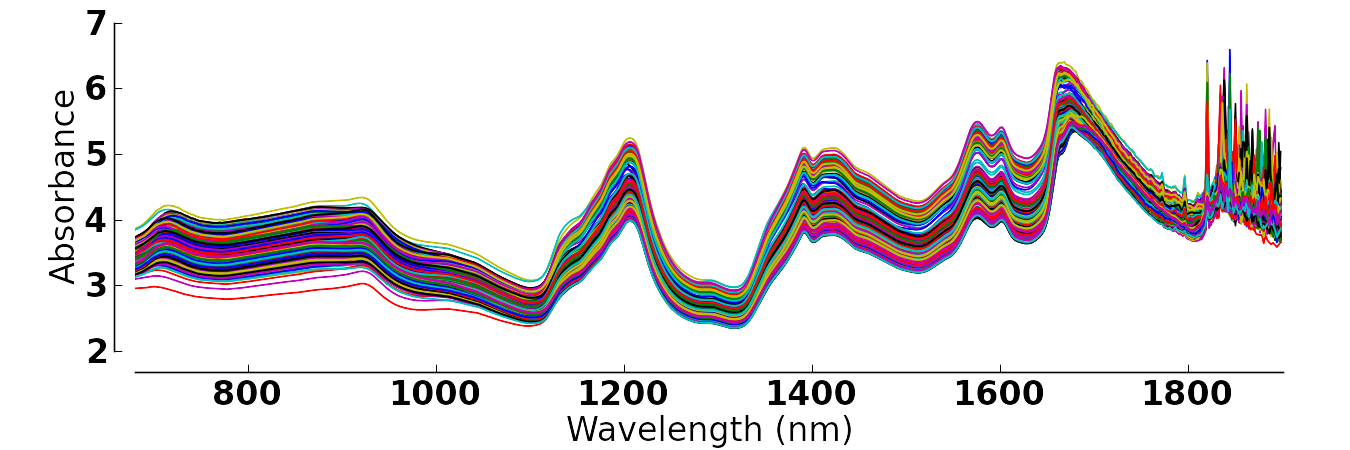
Thanks for any help!
 asked Mar 14 '26 19:03
You could always make your own function to do this ;I make such functions on a regular basis when nothing really fits my needs. I put this together rather quickly but you can adapt it to your needs.
# generate data
set.seed(6)
n <- 50
dat <- data.frame(x1=seq(1,100, length.out = n),
                  x2=seq(1,20, length.out = n)+rnorm(n),
                  x3=seq(1,20, length.out = n)+rnorm(n, mean = 3),
                  x4=seq(1,20, length.out = n)+rnorm(n, mean = 5))
# make some NAs at the end
dat[45:n,2] <- NA
dat[30:n,3] <- NA


plot_multi <- function(df, x=1, y=2, cols=y,
                       xlim=range(df[,x], na.rm = T),
                       ylim=range(df[,y], na.rm = T),
                       main="", xlab="", ylab="", ...){
  # setup plot frame
  plot(NULL,
       xlim=xlim,
       ylim=ylim,
       main=main, xlab=xlab, ylab=ylab)

  # plot all your y's against your x
  pb <- sapply(seq_along(y), function(i){
    points(df[,c(x, y[i])], col=cols[i], ...)
  })
}

plot_multi(dat, y=2:4, type='l', lwd=3, main = ":)",
           xlab = "Wavelength", ylab = "Absorbance")
Results in :

EDIT
I actually found your dataset online by chance, so I'll include how to plot it as well using my code above.
file <- 'http://openmv.net/file/tablet-spectra.csv'
spectra <- read.csv(file, header = FALSE)

# remove box label
spectra <- spectra[,-1]

# add the 'wavelength' and rotate the df
# (i didn't find the actual wavelength values, but hey).
spectra <- cbind(1:ncol(spectra), t(spectra))

plot_multi(spectra, y=2:ncol(spectra), cols = rainbow(ncol(spectra)),
           type='l', main=":))", ylab="Absorbance", xlab = "'Wavelength'")

answered Mar 16 '26 09:03
You could use the pavo R package, which is made to deal with spectral data (full disclosure, I'm one of the maintainers):
library(pavo)

df <- t(read.csv("http://openmv.net/file/tablet-spectra.csv", header = FALSE))
df <- df[-1, ]
df <- apply(df, 2, as.numeric)
df <- cbind(wl = seq_len(nrow(df)),
            df)

df <- as.rspec(df)
#> wavelengths found in column 1

plot(df, ylab = "Absorbance", col = rainbow(3))

Created on 2019-07-26 by the reprex package (v0.3.0)
If you love us? You can donate to us via Paypal or buy me a coffee so we can maintain and grow! Thank you!
Donate Us With
