This is very similar to this question (link), but I'm not quite sure how to manipulate it for my needs.
I have a faceted plot with two panels, and I would like to label three quadrants in the first panel and only the first panel.
Here is a mock data set:
dfr=data.frame(
 variable=rep(c("A","B"),each=2),
 x=c(2,-3,4,-5),
 y=c(-2,4,-2,6))
And here is the plot:
p=ggplot(dfr,aes(x,y))+
 geom_point()+
 facet_grid(variable~.)+
 scale_x_continuous(limits=c(-6,6))+
 scale_y_continuous(limits=c(-6,6))+
 geom_hline(yintercept=0)+
 geom_vline(xintercept=0)
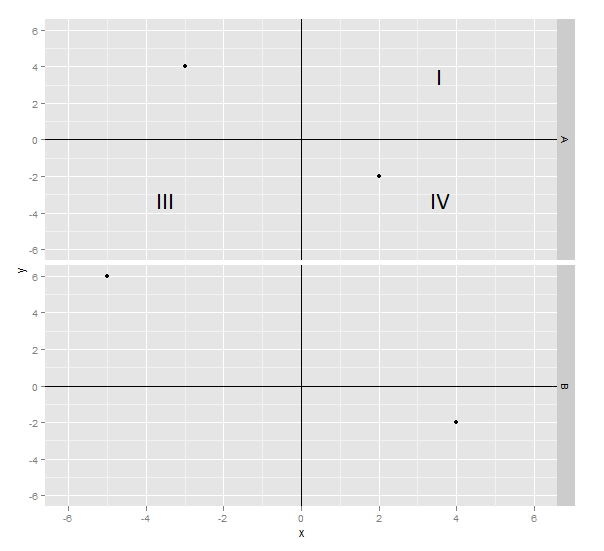
This is what I would like to accomplish:
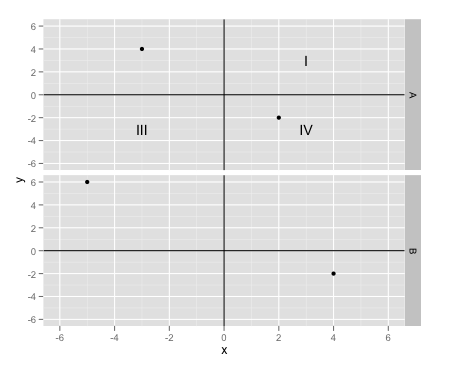
You can always create a separate data frame with the desired labels and plot them using geom_text:
dfLab <- data.frame(variable = rep("A",3),
                    x = c(3,3,-3),
                    y = c(3,-3,-3),
                    lab = c('I','IV','III'))


ggplot(dfr,aes(x,y))+
 geom_point()+
 facet_grid(variable~.)+
 scale_x_continuous(limits=c(-6,6))+
 scale_y_continuous(limits=c(-6,6))+
 geom_hline(yintercept=0)+
 geom_vline(xintercept=0) +
 geom_text(data = dfLab,aes(x=x,y=y,label=lab))
If you love us? You can donate to us via Paypal or buy me a coffee so we can maintain and grow! Thank you!
Donate Us With

