I would like to plot a scatter using matplotlib.pyplot.scatter, and because the number of the dots is too large, I'd like to make scales of these dots small. I set parameter s 0.1, and dots somehow become empty circles with a dot in the center.
Below is s=0.1, empty dots

But I just want solid dots, and after some trial, I found that the reason is parameter s, when s>=1, the plot is solid dots, but when s<1, it becomes empty.
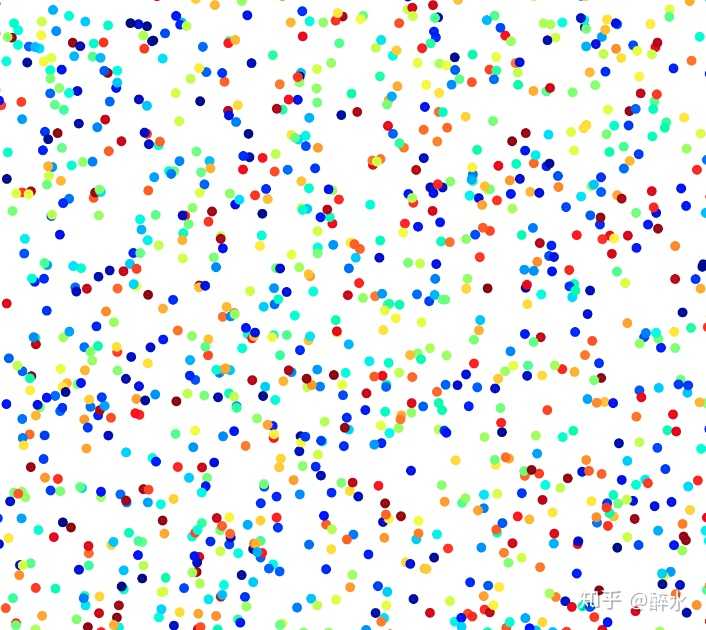
Below is s=1, solid dots
Below is my code, and I just changed parameter s
import matplotlib.pyplot as plt
import numpy as np
import matplotlib.cm as mcm

if __name__ == "__main__":
    a = np.random.rand(10000,2)
    fig = plt.figure(figsize=(6,6), dpi=800)
    ax = fig.add_subplot(111)
    color = np.random.rand(10000,)
    ax.scatter(a[:,0],a[:,1], s=1, marker='.', c=color, cmap=mcm.jet)
    plt.savefig("`some route`/123.png", format="png")
My version:
python: 3.7.3
matplotlib: 3.0.3
OS: Ubuntu 16.04 LTS
You should set edgecolors='none.
I think you can get what you are looking for with: ax.scatter(a[:,0],a[:,1], s=0.5, marker='o', c=color, cmap=mcm.jet, edgecolors='none')
See docs for scatter here https://matplotlib.org/3.1.1/api/_as_gen/matplotlib.pyplot.scatter.html
If you love us? You can donate to us via Paypal or buy me a coffee so we can maintain and grow! Thank you!
Donate Us With

