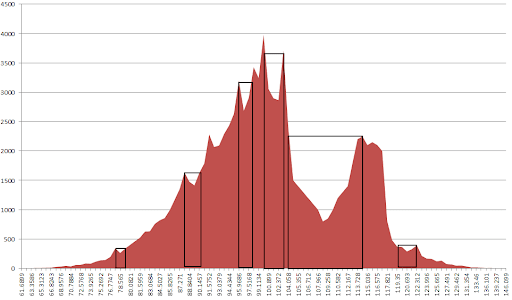
I'm interested in finding the local minima in a histogram that roughly resembles

I'd want to find the local minimum at 109.258, and the easiest way to do so would be to identify whether the number of counts at 109.258 is lower than the average number of counts around in some interval around (and including 109.258). It's identifying this interval that's the most difficult part for me.
As for the source of this data, it's a histogram with 100 bins of non-uniform width. Each bin has a value (shown on the x-axis), and a count of the samples falling into that bin (shown on the y-axis). What I'm trying to do is find the "best" place to split the histogram. Each side of the split is propagated down a binary tree, as part of a classification algorithm.
I'm thinking that my best course of action would be to try to fit a curve to this histogram, using something like the Levenberg-Marquardt algorithm and then to compare the local minima to find the "best" one. A proper measure of "best" would include some indication of the significance of that split, which is measured as the difference between the average counts in the interval to the left and the average of the counts in the interval to the right, and then maybe weight each difference with the number of counts included to get a composite measurement of "best," if that makes sense.
Either way, computational complexity of the algorithm isn't a huge issue, 100 bins is about the maximum number I'd expect to encounter. However, this calculation will be performed once for each sample, so keeping it linear with respect to the number of bins would, of course, be ideal.
By the way, I'm doing everything in C++, and make use of the boost libraries and STL, so nothing is off-limits in that regard.
Any thoughts or insights concerning best practices would be greatly appreciated!
If I understand correctly kmore wants to partition two "peaks" based on the largest separation (product of histogram count and bin distance). If this is true:
If you love us? You can donate to us via Paypal or buy me a coffee so we can maintain and grow! Thank you!
Donate Us With