alt text http://internationalpropertiesregistry.com/Server/showFile.php?file=%2FUpload%2Fstatistics.gifc49ca28823a561a41d09ef9adbb5e0c5.gif
The unit of x-axis is hours (h), and there are 24 hours in total.
The unit of y-axis is millions (m).
How do I calculate the area under the red curve in the image in units of m*h?
Important UPDATE
Only the image is readily available (not the data), and I want to calculate the area programmatically.
Here's an interesting solution :). Btw, it uses bwfill (similar to imfill) which needs some user interaction.
%# Constants
gray_value_curve = 2;
gray_value_box = 3;
area_box_in_units = 10;

%# Read the image
I = imread('C:\p23\graph.gif');
%# Find the area of a unit block
figure(1);
imshow(I,[]);
[BS sq_elem] = bwfill;
imshow(BS,[]);
%# Get the dimensions to make the estimate more accurate
X = zeros(size(BS));
X(sq_elem) = 1;
s = regionprops(X,'Area','BoundingBox');
block_area = s.Area + 2*(s.BoundingBox(3)-1) + 2*(s.BoundingBox(4)-1) + 4;

%#Find the area under the curve
I( ~(I == gray_value_curve | I == gray_value_box) ) = 0;
figure(2);
imshow(I,[]);
[BA area_curve_elem] = bwfill;
imshow(BA,[]);
%# Area under the curve
curve_area = numel(area_curve_elem);

%# Display the area in the required units
area = area_box_in_units*curve_area/block_area;
disp(area);
113.5259
Figure 1
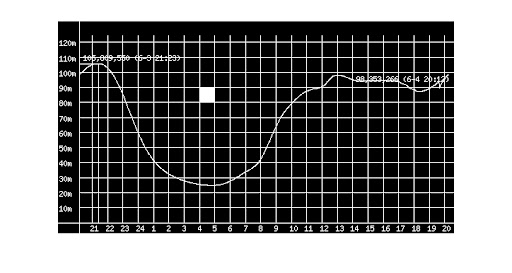 Figure 2
The difficulty with creating a fully-automated solution is that it would require you to hardcode into your solution certain assumptions about the input images you are going to process. If these assumptions don't hold for all the potential images you may come across, the fully-automated solution won't give trustworthy results, and trying to extend the fully-automated solution to handle all possible inputs will likely cause it to bloat into an incomprehensible and complicated mess of code.
When in doubt about the variability in features of your input images, a solution like Jacob's with some user interaction is generally best. If you can be certain that the features of your input images follow a strict set of rules, then an automated solution can be considered.
As an example, below is some automated code I wrote to approximate the area under the red curve in your graph. Since I used the above graph as a guide, there are a number of conditions that must be met for it to work:
Subject to the above conditions on the input image, the following code can be used to approximate the area under the red curve without user input:
[img,map] = imread('original_chart.gif'); %# Read the indexed image
[r,c] = size(img); %# Get the image size
redIndex = find((map(:,1) == 1) & ... %# Find the red index value
(map(:,2) == 0) & ...
(map(:,3) == 0))-1;
greenIndex = find((map(:,1) < 1) & ... %# Find the green index value
(map(:,2) == 1) & ...
(map(:,3) < 1))-1;
blueIndex = find((map(:,1) == 0) & ... %# Find the blue index value
(map(:,2) == 0) & ...
(map(:,3) == 1))-1;
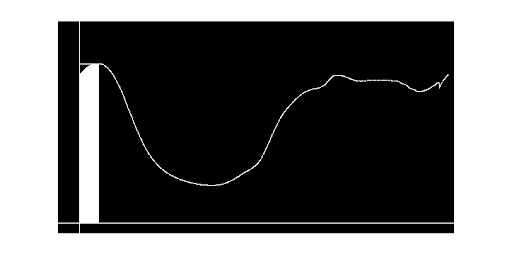
redLine = (img == redIndex); %# A binary image to locate the red line
greenLine = (img == greenIndex); %# A binary image to locate the grid lines
blueLine = (img == blueIndex); %# A binary image to locate the axes lines
w = mean(diff(find(sum(greenLine,1) > r/2))); %# Compute unit square width
h = mean(diff(find(sum(greenLine,2) > c/2))); %# Compute unit square height
squareArea = w*h; %# Compute unit square area
[maxValue,maxIndex] = max(redLine); %# Find top edge of red line
x = find(maxValue > 0); %# Find x coordinates of red line
y = maxIndex(maxValue > 0); %# Find y coordinates of red line
[maxValue,maxIndex] = max(sum(blueLine,2)); %# Find row index of x axis
y = maxIndex-y; %# Zero the y coordinate
totalArea = trapz(x,y)/squareArea; %# Compute the area under the curve
Which gives the following results:
squareArea = 460.6 square pixels
totalArea = 169.35 m*h
EXPLANATION:
I'll elaborate more about the steps involved in computing w:
greenLine is summed along each column using the function SUM, giving a 1-by-c vector where each element is a count of how many grid line pixels are in each column of the image.r/2 (half the number of rows in the image) indicate columns of the image that contain a vertical grid line. The indices of these columns are found using the function FIND.When computing h, the only difference is that the sum is performed along each row and r/2 is replaced with c/2 (half the number of columns in the image).
Since you only have the image available, I suggest you integrate by eye: count the number of whole squares underneath the red line.
For each square which the red line intersects, decide whether or not to include it in the count depending on how much lies below the line. Don't try to estimate how much of the square lies beneath the red line, at best that will give you an illusion of greater accuracy.
EDIT: I counted the green squares for you, the answer is 168 m.h
If you love us? You can donate to us via Paypal or buy me a coffee so we can maintain and grow! Thank you!
Donate Us With