I am trying to plot a heat map with ggplot2 and I would like to resize the colorbar and increase the font.
Here is the relevant part of the code:
g <- ggplot(data=melt.m)
g2 <- g+geom_rect(aes(xmin=colInd-1, xmax=colInd,
  ymin=rowInd-1, ymax=rowInd, fill=value))

g2 <- g2+scale_x_continuous('beta', breaks=c(1, ceiling(cols/2), rows)-0.5,
  labels=c(1,ceiling(cols/2), rows))
g2 <- g2+scale_y_continuous('alpha', breaks=c(1, ceiling(rows/2), rows)-0.5,
  labels=c(1, ceiling(rows/2), rows))

g2 <- g2+opts(panel.grid.minor=theme_line(colour=NA),
  panel.grid.major=theme_line(colour=NA),
  panel.background=theme_rect(fill=NA, colour=NA),
  axis.text.x=theme_text(size=30),
  axis.text.y=theme_text(size=30, angle=90),
  axis.title.x=theme_text(size=30),
  axis.title.y=theme_text(size=30, angle=90), title = title)

heatscale <- c(low='ghostwhite', high='steelblue')

g2 <- g2+scale_fill_gradient("", heatscale[1], heatscale[2], bias = 10)
It works fine, the problem is that the color legend on the right side is too small. Is there a way to make the color legend bigger and increase the font size of the legend?
Thanks,
kz
 asked Feb 03 '26 03:02
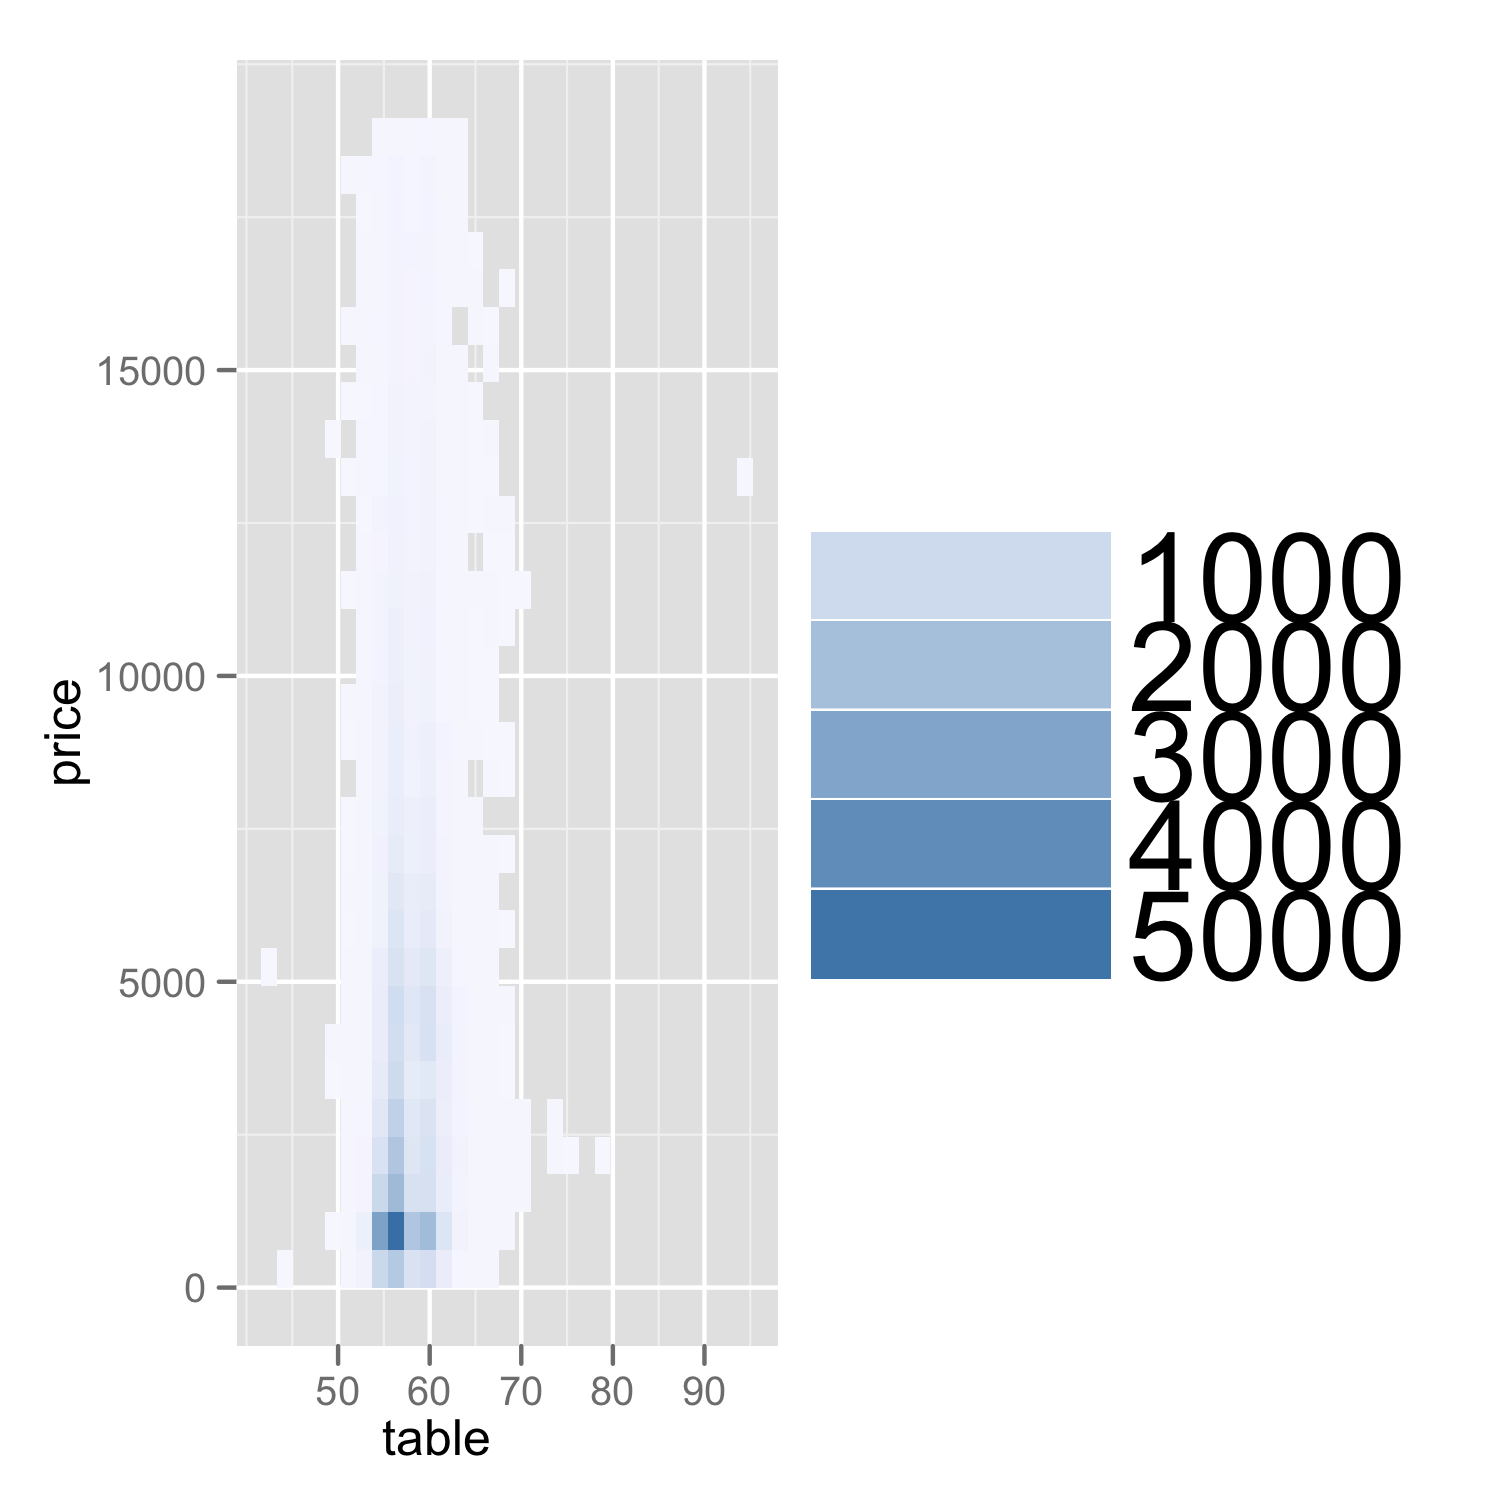
We don't have your melt.m data, so the code you give is not reproducible. Using the diamonds dataset that comes with ggplot2 as an example, though:
ggplot(diamonds, aes(x=table, y=price)) +
  geom_bin2d() +
  scale_fill_gradient("", 'ghostwhite', 'steelblue', bias=10) +
  opts(legend.key.width=unit(1, "in"),
       legend.text = theme_text(size=30))
legend.key.width and legend.text are what you are looking for. I have used exaggerated sizes to make it more obvious.
For more details on the options available, see https://github.com/hadley/ggplot2/wiki/+opts%28%29-List
I tried this and found that R or ggplot2 have changed in the last four years. It yielded the error:
Error: 'opts' is deprecated. Use 'theme' instead. (Defunct; last used in version 0.9.1)
Was able to get it to work with the following instead:
p + theme(legend.text = element_text(size=30),legend.key.size = unit(1, "in"))
Initially tried just changing the text size but had to change the key size with it or it becomes unreadable. Also, unit needs a library explicitly loaded with library(grid)
If you love us? You can donate to us via Paypal or buy me a coffee so we can maintain and grow! Thank you!
Donate Us With

