I just want to add annotation to each panel of figures generated by ggplot2; just simple labels like (a), (b), (c), etc. in each corner. Is there a simple way to do this?
facet_grid() forms a matrix of panels defined by row and column faceting variables. It is most useful when you have two discrete variables, and all combinations of the variables exist in the data.
While facet_grid shows the labels at the margins of the facet plot, facet_wrap creates a label for each plot panel.
facet_wrap() makes a long ribbon of panels (generated by any number of variables) and wraps it into 2d. This is useful if you have a single variable with many levels and want to arrange the plots in a more space efficient manner.
From: https://groups.google.com/forum/?fromgroups=#!topic/ggplot2/RL8M7Ut5EpU you can use the following:
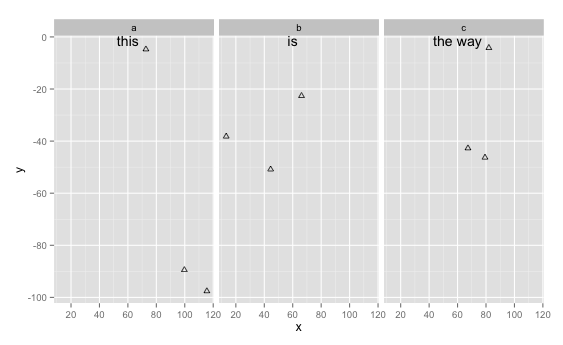
library(ggplot2) x <-runif(9, 0, 125) data <- as.data.frame(x) data$y <- runif(9, 0, 125) data$yy <- factor(c("a","b","c")) ggplot(data, aes(x, y)) + geom_point(shape = 2) + facet_grid(~yy) + geom_text(aes(x, y, label=lab), data=data.frame(x=60, y=Inf, lab=c("this","is","the way"), yy=letters[1:3]), vjust=1) which should give you this:

Basically, you create a data.frame with the text which contains a column with the text, and a column with the variables you use for facet_grid. You can then simply add a geom_text with that data.frame. See the documentation of geom_text for more details on text placement and such.
If you love us? You can donate to us via Paypal or buy me a coffee so we can maintain and grow! Thank you!
Donate Us With