I'm trying to display data from a multidimensional array using d3. Using the code below, nothing is appearing in the browser. Inspecting element shows that the text of each element in each array exists, but they are just not appearing on the page. However, when I remove the lines that have been commented below, I get the example output below:
1,3,3,5,6,7

3,5,8,3,2,6

9,0,6,3,6,3

etc ...
How can I modify the code so that I can display something like this:
1 3 3 5 6 7

3 5 8 3 2 6

etc...
The code:
var dataset = [
    [1,3,3,5,6,7],
    [3,5,8,3,2,6],
    [9,0,6,3,6,3],
    [3,4,4,5,6,8],
    [3,4,5,2,1,8]
];

var svg = d3.select("body")
    .append("svg")
    .attr("width", w)
    .attr("height", h);

svg.append("g")
    .selectAll("p")
    .data(dataset)
    .enter()
    .append("p") // removing
    .selectAll("text") // these
    .data( function(d,i,j) { return d; } ) // lines
    .enter() // text displays normally
    .append("text")
    .text( function(d,i,j) { return d; } )
    .attr("x", function(d,i,j) { return (i * 20) + 40; })
    .attr("y", function(d,i,j) { return (i * 20) + 40; })
    .attr("font-family", "sans-serif")
    .attr("font-size", "20px")
    .attr("fill", textColour);
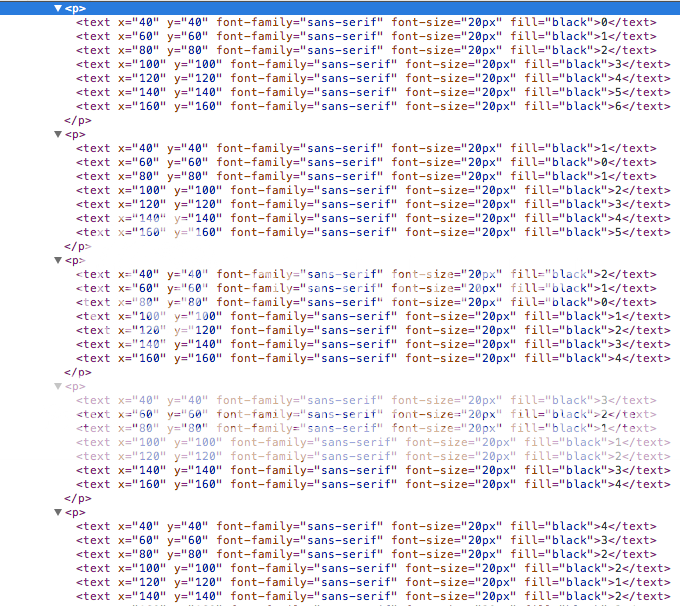
This is what inspecting element gives with a different array of numbers:

You're almost there, there are only two minor things:
p element in SVG -- use g instead.j of the parent element instead of i.Complete example here.
If you love us? You can donate to us via Paypal or buy me a coffee so we can maintain and grow! Thank you!
Donate Us With