I setup Laravel Homestead. I then configured both homestead xdebug.ini and PHPStorm to make the debugging work.
Here is my xdebug.ini inside homestead
zend_extension=xdebug.so
xdebug.remote_autostart = on
xdebug.remote_enable = on
xdebug.remote_connect_back = on
xdebug.remote_port = 9000
xdebug.idekey = "vagrant"
To start a debugging session the steps I follow are
This works perfectly. My problem is when I'm inside homestead command line and I run a php artisan command then I can't get it to hit my breakpoints.
What I've tried
XDEBUG_CONFIG="idekey=PHPSTORM" PHP_IDE_CONFIG="serverName=server_name" php -dxdebug.remote_host="127.0.0.1" artisan mycommand
php -d xdebug.profiler_enable=On artisan mycommand
I also tried to set xdebug.remote_autostart=On then sudo service php5-fpm restart but still my breakpoints never get hit in PHPStorm
Two things are important:
remote_connect_back can not work in the CLI case because Xdebug can not detect the remote IP when you are in the console127.0.0.1 seen from inside the VM. Instead, it has usually an IP like 10.0.2.2. To find out the correct IP, have a look at your Apache's access.log,The following worked for me:
php -dxdebug.remote_autostart=on -dxdebug.remote_connect_back=off
  -dxdebug.remote_host=10.0.2.2 artisan

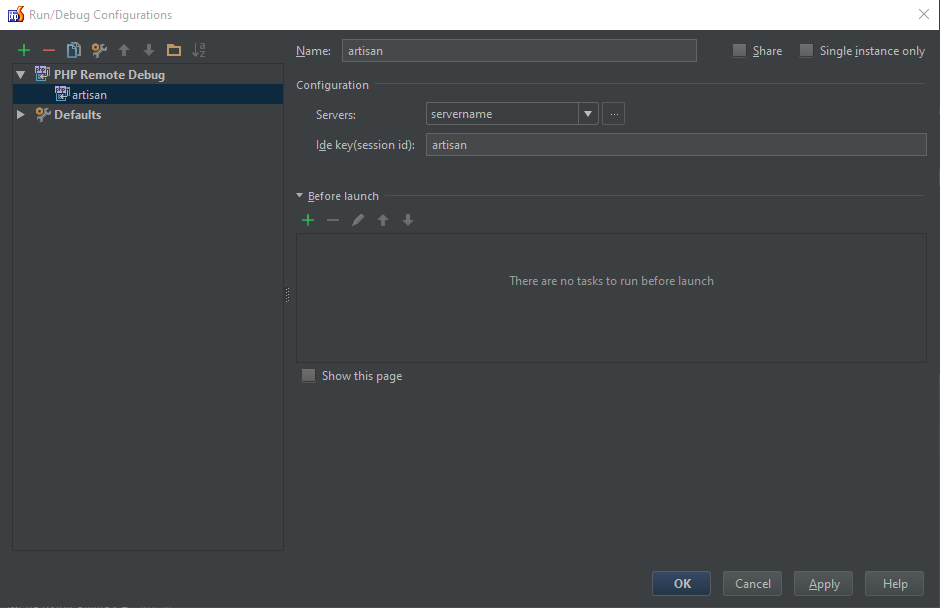
Do export PHP_IDE_CONFIG="serverName=yourservername" in your VM, where yourservername is what you configured in the screenshot under "name"
Add a Php Remote Debug Configuration with an IDE key and the server configured above

And add your IDE key and the remote_host to the VM's XDEBUG-CONFIG
export XDEBUG_CONFIG="idekey=artisan remote_host=10.0.2.2"
References: http://randyfay.com/content/remote-command-line-debugging-phpstorm-phpdrupal-including-drush
Or, if that all is just too complicated or not working - you can trigger your artisan command via a url (route) using
Artisan::call('whatever:command');
If you love us? You can donate to us via Paypal or buy me a coffee so we can maintain and grow! Thank you!
Donate Us With