I'm making a large number of seqlogos programmatically. They are hundreds of columns wide and so running a seqlogo normally creates letters that are too thin to see. I've noticed that I only care about a few of these columns (not necessarily consecutive columns) ... most are noise but some are highly conserved.
I use something like this snippet:
wide_seqs = cell2mat(arrayfun(@randseq, repmat(200, [500 1]), 'uniformoutput', false));
wide_seqs(:, [17,30, 55,70,130]) = repmat(['ATCGG'], [500 1])

conserve_cell = seqlogo(wide_seqs, 'displaylogo', false);
high_bit_cols = any(conserve_cell{2}>1.0,1);
[~, handle] = seqlogo(wide_seqs(:,high_bit_cols ));
Although when I do this I lose the information about which columns the data came from.
Normally I would just change the x-axis of the seqlogo. However, seqlogo's are some sort of crazy java-based object and calls like:
set(handle, 'xticklabel', num2str(find(high_bit_cols)))
don't work. Any help would be greatly appreciated.
Thanks, Will
EDIT:
On the bounty I'm willing to accept any kind of crazy method for changing the axis labels include (but not limited to): Using the image-processing toolbox to modify the image after saving, creating a new seqlogo function using textboxes, modifying the java-code (if possible), etc. I'm NOT willing to accept things like "use python", "use this R library" or any other sort of non-Matlab solution.
OK, I killed a few hours with this problem. It appears that you cannot place any MATLAB object (axes or textbox) on the top of that hgjavacomponent object. And I couldn't modified the java code, of course. So the only feasible solution I found is to create the figure from scratch.
I didn't want to rewrite the code to calculate weight matrices (symbols heights), you already did that. But it can be done, if you don't want to use MATLAB's seqlogo at all. So I've changed your last line a little to get the matrix:
[wm, handle] = seqlogo(wide_seqs(:,high_bit_cols ));
The problem with text symbols is that you cannot exactly control their size, cannot fit the symbol to textbox. This is probably why MATLAB decided to go with java graphic object. But we can create symbols images and deal with them.
Here is code to create images of letters:
letters = wm{1};
clr = [0 1 0; 0 0 1; 1 0.8 0;1 0 0]; % corresponding colors
for t = 1:numel(letters)
    hf = figure('position',[200 200 100 110],'color','w');
    ha = axes('parent',hf, 'visible','off','position',[0 0 1 1]);
    ht = text(50,55,letters(t),'color',clr(t,:),'units','pixels',...
        'fontsize',100,'fontweight','norm',...
        'vertical','mid','horizontal','center');
    F = getframe(hf); % rasterize the letter
    img = F.cdata;
    m = any(img < 255,3); % convert to binary image
    m(any(m,2),any(m,1))=1; % mask to cut white borders
    imwrite(reshape(img(repmat(m,[1 1 3])),[sum(any(m,2)) sum(any(m,1)) 3]),...
        [letters(t) '.png'])
    close(hf)
end
Then we use those images to draw new seqlogo plot:
xlabels = cellstr(num2str(find(high_bit_cols)'));
letters = wm{1};
wmat=wm{2}; % weight matrix from seqlogo
[nletters  npos] = size(wmat);
wmat(wmat<0) = 0; % cut negative values

% prepare the figure
clf
hAx = axes('parent',gcf,'visible','on');
set(hAx,'XLim',[0.5 npos+0.5],'XTick',1:npos,'XTickLabel',xlabels)
ymax = ceil(max(sum(wmat)));
ylim([0 ymax])
axpos = get(hAx,'Position');
step = axpos(3)/npos;

% place images of letters
for i=1:npos
    [wms idx] = sort(wmat(:,i)); % largest on the top
    let_show = letters(idx);
    ybot = axpos(2);
    for s=1:nletters
        if wms(s)==0, continue, end;
        axes('position',[axpos(1) ybot step wms(s)/ymax*axpos(4)])
        ybot = ybot + wms(s)/ymax*axpos(4);
        img = imread([let_show(s) '.png']);
        image(img)
        set(gca,'visible','off')
    end
    axpos(1)=axpos(1)+step;
end
Here is the result: alt text http://img716.imageshack.us/img716/2073/seqlogoexample.png
The code and figure can be further improved, of course, but I hope this is something you can start working with. Let me know if I miss something.
I ran into the same problems yuk did trying to modify the figure from SEQLOGO, so here's my attempt at my own version to mimic its appearance. It's a function seqlogo_new.m that you give two arguments: your sequence and an optional minimum bit value. It requires an image file ACGT.jpg that can be found at this link.
Here's the code for the function:
function hFigure = seqlogo_new(S,minBits)
%# SEQLOGO_NEW   Displays sequence logos for DNA.
%#   HFIGURE = SEQLOGO_NEW(SEQS,MINBITS) displays the
%#   sequence logo for a set of aligned sequences SEQS,
%#   showing only those columns containing at least one
%#   nucleotide with a minimum bit value MINBITS. The
%#   MINBITS parameter is optional. SEQLOGO_NEW returns
%#   a handle to the rendered figure HFIGURE.
%#
%#   SEQLOGO_NEW calls SEQLOGO to perform some of the
%#   computations, so to use this function you will need
%#   access to the Bioinformatics Toolbox.
%#
%#   See also seqlogo.

%# Author: Ken Eaton
%# Version: MATLAB R2009a
%# Last modified: 3/30/10
%#---------------------------------------------------------

  %# Get the weight matrix from SEQLOGO:

  W = seqlogo(S,'DisplayLogo',false);
  bitValues = W{2};

  %# Select columns with a minimum bit value:

  if nargin > 1
    highBitCols = any(bitValues > minBits,1);  %# Plot only high-bit columns
    bitValues = bitValues(:,highBitCols);
  else
    highBitCols = true(1,size(bitValues,2));   %# Plot all columns
  end

  %# Sort the bit value data:

  [bitValues,charIndex] = sort(bitValues,'descend');  %# Sort the columns
  nSequence = size(bitValues,2);                      %# Number of sequences
  maxBits = ceil(max(bitValues(:)));                  %# Upper plot limit

  %# Break 4-letter image into a 1-by-4 cell array of images:

  imgACGT = imread('ACGT.jpg');                %# Image of 4 letters
  [nRows,nCols,nPages] = size(imgACGT);        %# Raw image size
  letterIndex = round(linspace(1,nCols+1,5));  %# Indices of letter tile edges
  letterImages = {imgACGT(:,letterIndex(1):letterIndex(2)-1,:), ...
                  imgACGT(:,letterIndex(2):letterIndex(3)-1,:), ...
                  imgACGT(:,letterIndex(3):letterIndex(4)-1,:), ...
                  imgACGT(:,letterIndex(4):letterIndex(5)-1,:)};

  %# Create the image texture map:

  blankImage = repmat(uint8(255),[nRows round(nCols/4) 3]);  %# White image
  fullImage = repmat({blankImage},4,2*nSequence-1);  %# Cell array of images
  fullImage(:,1:2:end) = letterImages(charIndex);    %# Add letter images
  fullImage = cat(1,cat(2,fullImage{1,:}),...        %# Collapse cell array
                    cat(2,fullImage{2,:}),...        %#   to one 3-D image
                    cat(2,fullImage{3,:}),...
                    cat(2,fullImage{4,:}));

  %# Initialize coordinates for the texture-mapped surface:

  X = [(1:nSequence)-0.375; (1:nSequence)+0.375];
  X = repmat(X(:)',5,1);     %'# Surface x coordinates
  Y = [zeros(1,nSequence); cumsum(flipud(bitValues))];
  Y = kron(flipud(Y),[1 1]);  %# Surface y coordinates
  Z = zeros(5,2*nSequence);   %# Surface z coordinates

  %# Render the figure:

  figureSize = [602 402];                   %# Figure size
  screenSize = get(0,'ScreenSize');         %# Screen size
  offset = (screenSize(3:4)-figureSize)/2;  %# Offset to center figure
  hFigure = figure('Units','pixels',...
                   'Position',[offset figureSize],...
                   'Color',[1 1 1],...
                   'Name','Sequence Logo',...
                   'NumberTitle','off');
  axes('Parent',hFigure,...
       'Units','pixels',...
       'Position',[60 100 450 245],...
       'FontWeight','bold',...
       'LineWidth',3,...
       'TickDir','out',...
       'XLim',[0.5 nSequence+0.5],...
       'XTick',1:nSequence,...
       'XTickLabel',num2str(find(highBitCols)'),...  %'
       'YLim',[-0.03 maxBits],...
       'YTick',0:maxBits);
  xlabel('Sequence Position');
  ylabel('Bits');
  surface(X,Y,Z,fullImage,...
          'FaceColor','texturemap',...
          'EdgeColor','none');
  view(2);

end
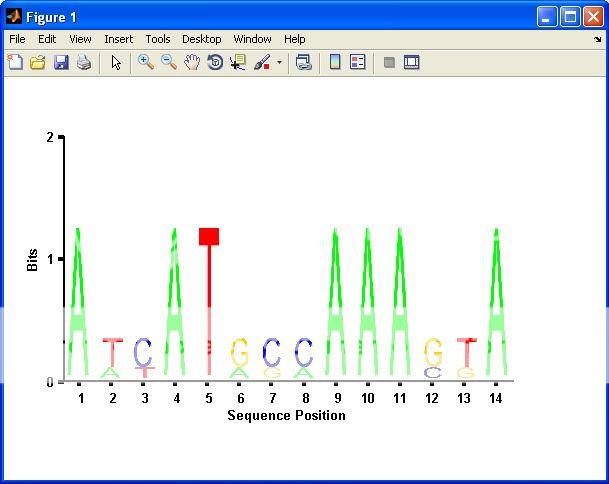
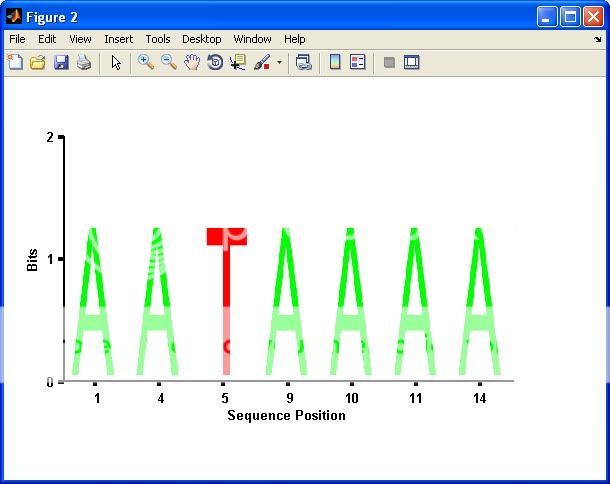
And here are a few examples of its usage:
S = ['ATTATAGCAAACTA'; ...  %# Sample data
     'AACATGCCAAAGTA'; ...
     'ATCATGCAAAAGGA'];
seqlogo_new(S);             %# A normal plot similar to SEQLOGO
seqlogo_new(S,1); %# Plot only columns with bits > 1
If you love us? You can donate to us via Paypal or buy me a coffee so we can maintain and grow! Thank you!
Donate Us With


