Is it possible to remove the axes from a pyplot.figure()?
Using the pyplot.imsave() to create an image without axes works OK
plt.imsave(file, zi)
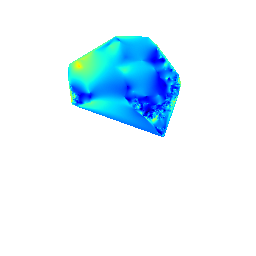
but it's limited because it only works with grid data.
When I use pyplot.figure() and save it using pyplot.savefig() as follows
...
# create figure
fig = plt.figure(figsize=(1.0,1.0))
# apply contour plot
plt.contour(zi,15,linewidths=0.1,colors='k')
plt.contourf(zi,15,cmap=plt.cm.jet)
# flip the y-axis
ax = plt.gca()
ax.set_ylim(ax.get_ylim()[::-1])
# save to file, 256x256 pixels
plt.savefig(file1, dpi=256)
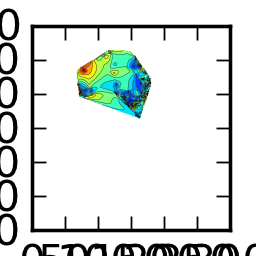
the saved image keeps it's axis, as seen on image above.
I was able to remove the axis display and any spacing that was allocated to the axis with the following code:
fig = plt.figure(figsize=(1.0,1.0))
ax = fig.add_axes([0.0, -0.2, 1.2, 1.2])
plt.contour(zi,15,linewidths=0.1,colors='k')
plt.contourf(zi,15,cmap=plt.cm.jet)
ax.set_ylim(ax.get_ylim()[::-1])
ax.set_axis_off()
plt.savefig(file1, dpi=256)
If you love us? You can donate to us via Paypal or buy me a coffee so we can maintain and grow! Thank you!
Donate Us With
