I have a plotly plot where the title is placed in the plot area by default. I would like to change this to have the plot title outside of the plot area.

In the screenshot, the title is in the "plot area" (light grey), I would like this to be above the plot area.
My current code only has the title argument in the plot layout:
plt <- plt %>%
layout(
    title = sprintf('Ice-formation Risk <br>%s',
                    format(Sys.time(),format = '%d %b %Y %H:%M %Z')))
I've tried playing with some of the parameters indicated in plotly reference without success:
plt <- plt %>%
layout(
  title = list(
    text = sprintf('Ice-formation Risk <br>%s',
                   format(Sys.time(),format = '%d %b %Y %H:%M %Z')),
    xref = 'paper', yref = 'paper',
    color = 'rgb(17,17,17)'
  )
)
The moment I change the title attribute from a string to a list, the plot title vanishes. I've experimented with removing the xref and yref parameters and leaving only the text attribute with the same result.
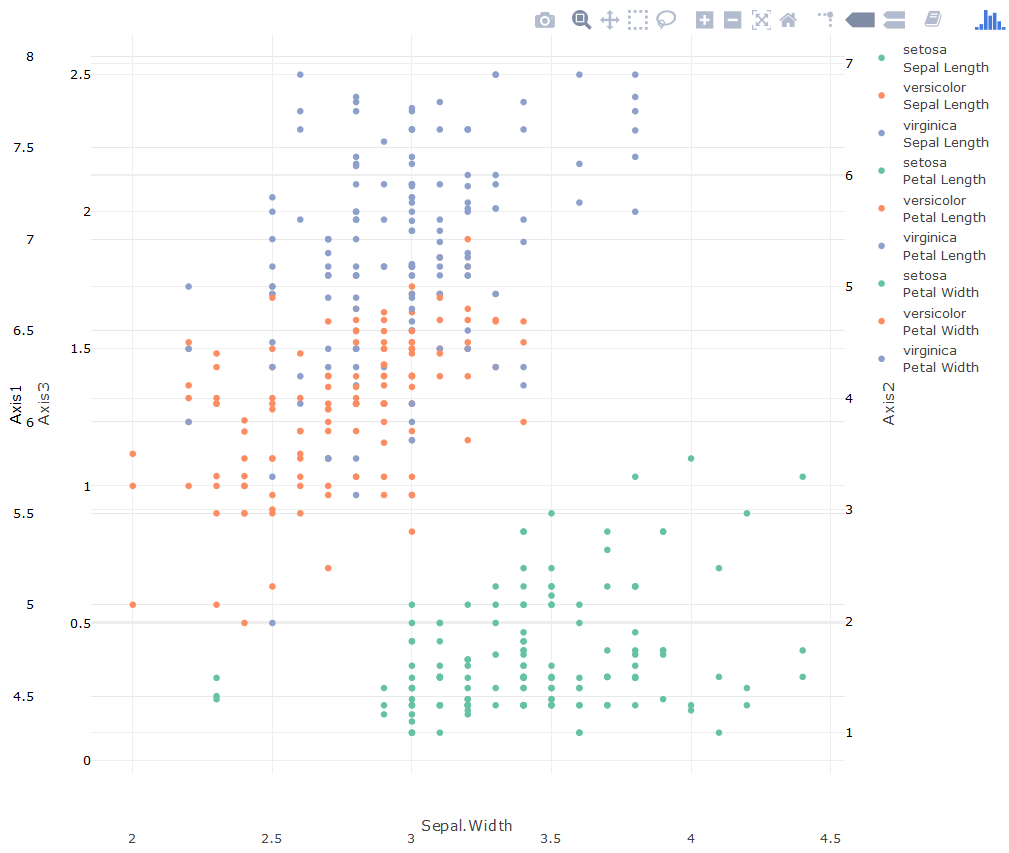
Sample Code
plot1 <- plot_ly(iris) %>%
  layout(
    title = list(
      text = 'sample plot', xref = 'x', yref = 'y', x = 0.5, y = 1, color = 'rgb(217,83,79)'
    ),
    margin = list( pad = 50, b = 90, l = 130, r = 50 ),
    yaxis = list(
      showline = F, side = 'left', title = 'Axis1', color = 'black',
      overlaying = 'y3', zeroline = F
    ),
    yaxis2 = list(
      tickfont = list(color = "black"), showline = F, overlaying = "y3", side = "right",
      title = "Axis2", zeroline = F, anchor = 'free', position = 1
    ),
    yaxis3 = list(
      tickfont = list(color = "black"), side = "left", title = "Axis3",
      zeroline = F, anchor = 'free'
    )
  ) %>%
  add_trace(x = ~Sepal.Width, y = ~Sepal.Length, name = 'Sepal Length', color = ~Species,
            type = 'scatter', mode = 'markers') %>%
  add_trace(x = ~Sepal.Width, y = ~Petal.Length, name = 'Petal Length', color = ~Species,
            type = 'scatter', mode = 'markers', yaxis = 'y2') %>%
  add_trace(x = ~Sepal.Width, y = ~Petal.Width, name = 'Petal Width', color = ~Species,
            type = 'scatter', mode = 'markers', yaxis = 'y3')
The plot title still vanishes. I have three y-axes in there because my actual plot needs to have three. The margin values were "tweaked" to get the axis labels to show properly, else they overlap and are unreadable.
That is really odd. Usually the reference is quite accurate. I submitted an issue to Github. Especially since the documentation on the project website still uses title="some string".
Anyways for the moment I recommend you use the annotations option instead. This one works like it is described in the reference ;)
It is a bit of a hack though. If you put yshift too high it escapes. I hope it helps anyways:
plot_ly(iris) %>%
  add_trace(x = ~Sepal.Width, y = ~Sepal.Length, name = 'Sepal Length', color = ~Species,
            type = 'scatter', mode = 'markers') %>%
  add_trace(x = ~Sepal.Width, y = ~Petal.Length, name = 'Petal Length', color = ~Species,
            type = 'scatter', mode = 'markers', yaxis = 'y2') %>%
  add_trace(x = ~Sepal.Width, y = ~Petal.Width, name = 'Petal Width', color = ~Species,
            type = 'scatter', mode = 'markers', yaxis = 'y3') %>%
  layout(
       margin = list( pad = 50, b = 90, l = 130, r = 50 ),
    yaxis = list(
      showline = F, side = 'left', title = 'Axis1', color = 'black' ,
      overlaying = 'y3', zeroline = F
    ),
    yaxis2 = list(
      tickfont = list(color = "black"), showline = F, overlaying = "y3", side = "right",
      title = "Axis2", zeroline = F, anchor = 'free', position = 1
    ),
    yaxis3 = list(
      tickfont = list(color = "black"), side = "left", title = "Axis3",
      zeroline = F, anchor = 'free'
    ),annotations=list(text="sample text",xref="paper",x=0.5,
                      yref="paper",y=1,yshift=30,showarrow=FALSE,
                      font=list(size=24,color='rgb(217,83,79)'))
  )
Looks like this:

If you love us? You can donate to us via Paypal or buy me a coffee so we can maintain and grow! Thank you!
Donate Us With

