I have a data.frame of x/y/z points. I know how to make a 3d scatterplot using the rgl package but I would like to connect each point in the scatterplot to make a wireframe or surface plot.
This code returns the scatter plot
library(rgl)
Data <- expand.grid(x=seq(0,10),y=seq(0,10))
Data$z <- Data$x^2+Data$y^2
plot3d(Data)
While this code returns a blank graph:
plot3d(Data,type='wire')
I can make the plot I want with lattice:
library(lattice)
wireframe(z~x+y,Data)
I can even make it rotate:
library(TeachingDemos)
rotate.wireframe(z~x+y,Data)
But I prefer rgl over lattice because it renders much quicker and lets you rotate the plot with the mouse.
Whats the proper way to make a wireframe plot in rgl?
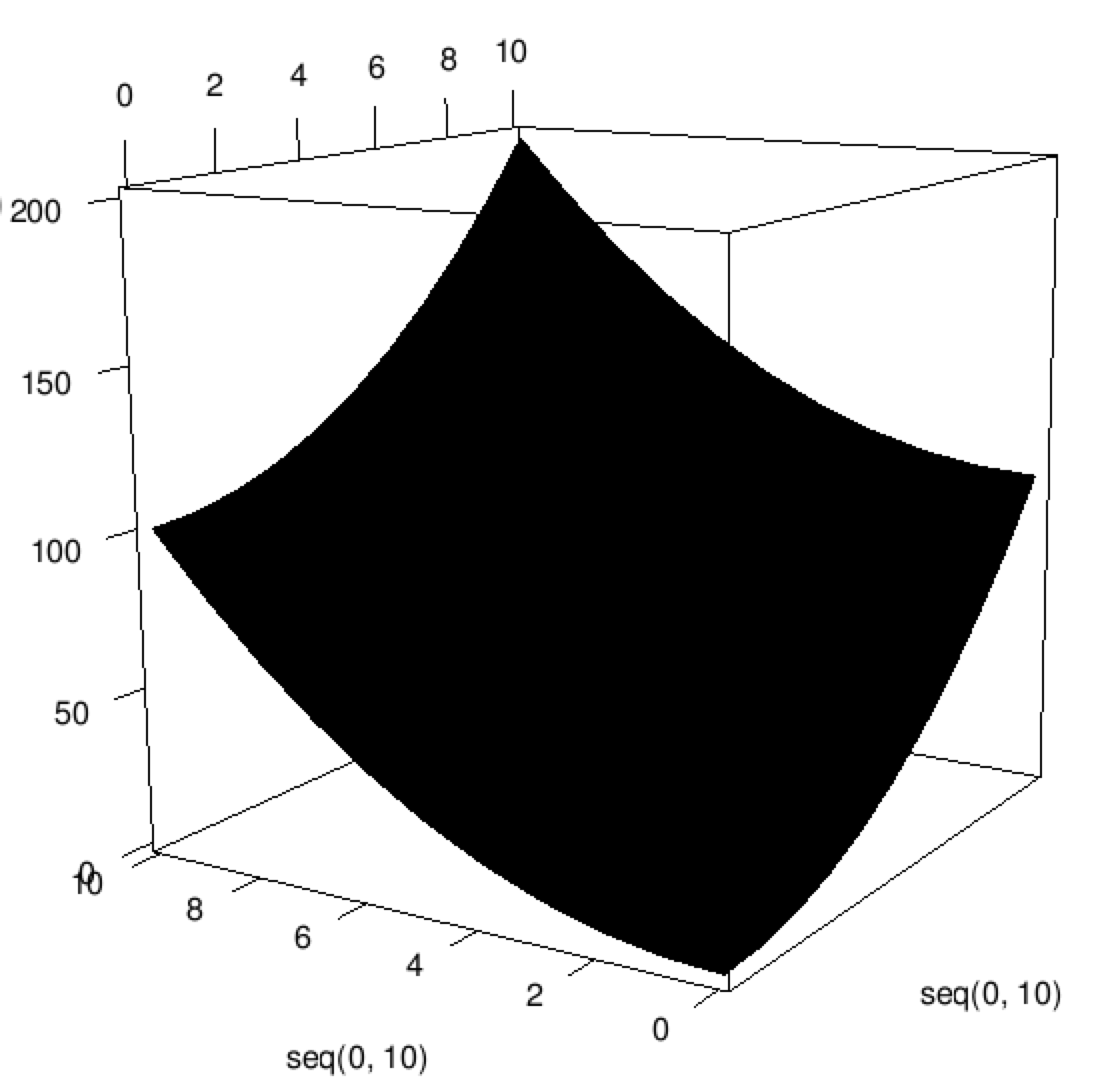
The surface drawing plot function in rgl is persp3d and like base::persp, it needs a matrix as input to the z argument
zmat <- matrix(Data$z, 11,11)
persp3d(x=seq(0,10), y=seq(0,10), z=zmat)
I did spin this graphic a bit before capturing it with a screen grabbing program I use:
If you love us? You can donate to us via Paypal or buy me a coffee so we can maintain and grow! Thank you!
Donate Us With

