Menu
Menu
How can I assign colors with implicit_plot?
using ImplicitPlots, Plots
v = [(x,y) -> (x+3)*(y^3-7)+18, (x,y) -> sin(y*exp(x)-1)]
p = plot()
for f in v
    implicit_plot!(f; xlims = (-1, 3), ylims = (-1, 2), framestyle = :origin, lc = [:red, :blue])
end
p
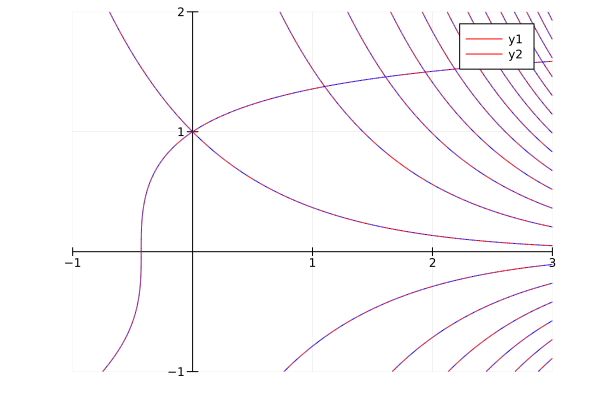
I expected something along the lines of:
lc = [:red, :blue]
for (i, f) in enumerate (v)
    implicit_plot!(f; xlims = (-1, 3), ylims = (-1, 2), lc = lc[i])
end
How can I pass a gradient of blue colors for the second function? (I can pass lc = :blues but that makes the first line blue as well.)
Bonus question: Can I pass a vector or tuple to implicit_plot? I guess it's not supported.
 259
259
Are you sure it does not work? I tried
lc = [:red, :blue]
for (i, f) in enumerate(v)
    implicit_plot!(f; xlims = (-1, 3), ylims = (-1, 2), lc = lc[i])
end
and I got

(You had an extra space in enumerate which maybe threw you off?)
Not sure about the tuple of functions.
125
If you love us? You can donate to us via Paypal or buy me a coffee so we can maintain and grow! Thank you!
Donate Us With