I was wondering if there's a way to plot a data cube in Python. I mean I have three coordinate for every point
x=part.points[:,0]
y=part.points[:,1]
z=part.points[:,2]
And for every point I have a scalar field t(x,y,z)
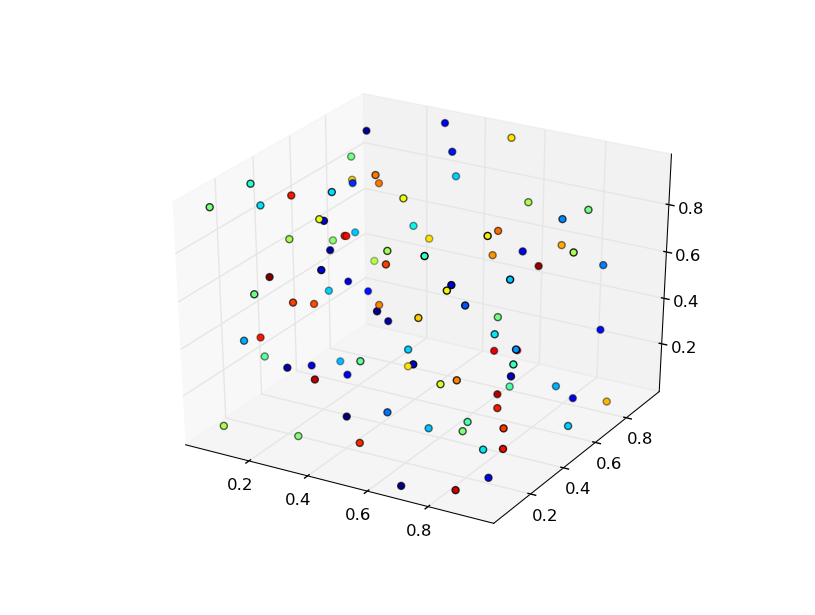
I would like to plot a 3D data cube showing the position of the point and for every point a color which is proportional to the scalar field t in that point.
I tried with histogramdd but it didn't work.
You can use matplotlib. Here you have a working example (that moves!):
import random
from matplotlib import pyplot
from mpl_toolkits.mplot3d import Axes3D

mypoints = []
for _ in range(100):
    mypoints.append([random.random(),    #x
                    random.random(),     #y
                    random.random(),     #z
                    random.randint(10,100)]) #scalar

data = zip(*mypoints)           # use list(zip(*mypoints)) with py3k

fig = pyplot.figure()
ax = fig.add_subplot(111, projection='3d')

ax.scatter(data[0], data[1], data[2], c=data[3])
pyplot.show()
You probably have to customize the relation of your scalar values with the corresponding colors.
Matplotlib has a very nice look but it can be slow drawing and moving these 3D drawings when you have many points. In these cases I used to use Gnuplot controlled by gnuplot.py. Gnuplot can also be used directly as a subprocess as shown here and here.
If you love us? You can donate to us via Paypal or buy me a coffee so we can maintain and grow! Thank you!
Donate Us With

