Okay so I appreciate this will require a bit of patience but bear with me. I'm analysing some Raman spectra and have written the basis of a program to use Scipy curve_fit to fit multiple lorentzians to the peaks on my data. The trick is I have so much data that I want the program to automatically identify initial guesses for the lorentzians, rather than manually doing it. On the whole, the program gives it a good go (and might be of use to others with a similar use case with simpler data), but I don't know Scipy well enough to optimise the curve_fit enough to make it work on many different examples.
Code repo here: https://github.com/btjones-me/raman_spectroscopy
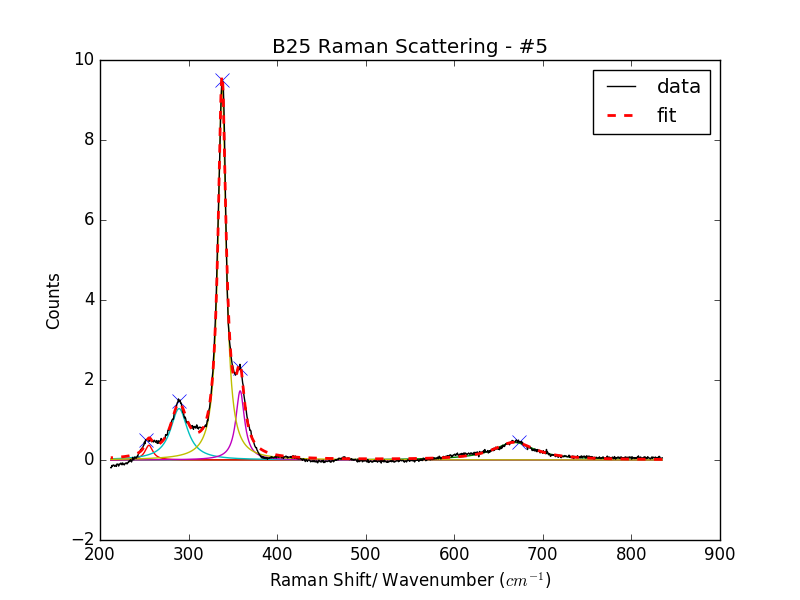
An example of it working well can be see in fig 1.
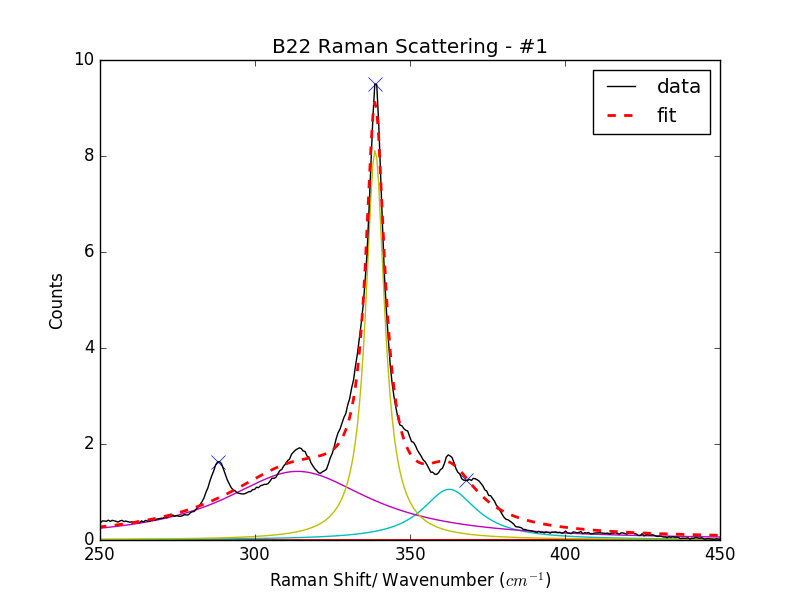
Part of the problem is my peak finding algorithm, which sometimes struggles to find the appropriate starting positions for each lorentzian. You can see this in fig 2.
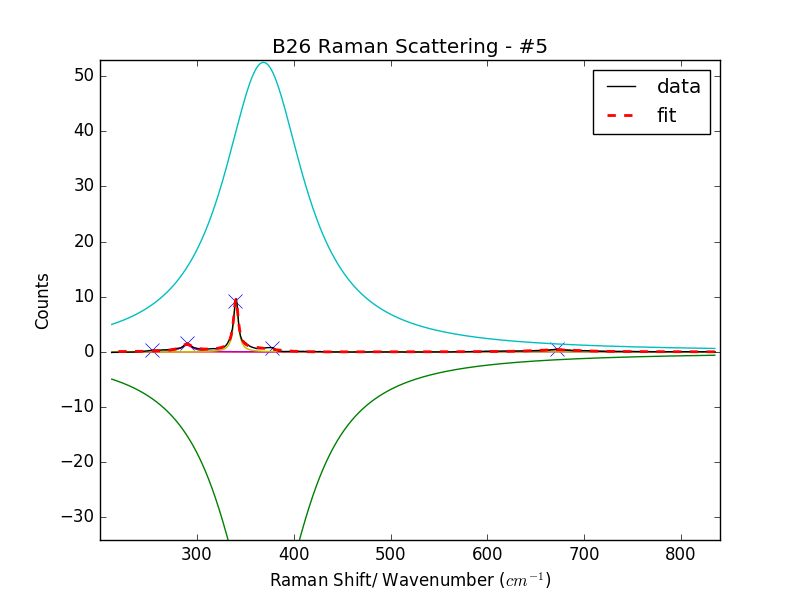
The next problem is that, for some reason, curve_fit occasionally catastrophically diverges (my best guess is due to rounding errors). You can see this behaviour in fig 3.
Finally while I usually make good guesses with the height and x position of each lorentzian, I haven't found a good way of predicting the width, or FWHM of the curves. Predicting this might help curve_fit.
If anybody can help with either of these problems in any way I would appreciate it greatly. I'm open to any other methods or suggestions including additional third party libraries, so long as they improve upon the current implementation. Many thanks to anybody who attempts this one!
Here it is working exactly as I intend:
Below you can see the peak finding method has failed to identify all the peaks. There are many peak finding algorithms, but the one I use is Scipy's 'find_peaks_cwt()' (it's not usually this bad, this is an extreme case).
Here it's just totally way off. This happens fairly often and I can't really understand why, nor stop it from happening. Possibly it occurs when I tell it to find more/less peaks than are available in the spectra, but just a guess.
I've done this in Python 3.5.2. PS I know I won't be winning any medals for code layout, but as always comments on code style and better practices are welcomed.
 asked Mar 14 '26 16:03
I stumbled across this because I'm attempting to solve the exact same problem, here is my solution. For each peak, I only fit my lorentzian in the region of the domain + or - 1/2 the distance to the next closest peak. Here is my function that does breaks up the domain:
def get_local_indices(peak_indices):
#returns the array indices of the points closest to each peak (distance to next peak/2)
chunks = []

for i in range(len(peak_indices)):
    peak_index = peak_indices[i]
    if i>0 and i<len(peak_indices)-1:
        distance = min(abs(peak_index-peak_indices[i+1]),abs(peak_indices[i-1]-peak_index))
    elif i==0:
        distance = abs(peak_index-peak_indices[i+1])
    else:
        distance = abs(peak_indices[i-1]-peak_index)


    min_index = peak_index-int(distance/2)
    max_index = peak_index+int(distance/2)
    indices = np.arange(min_index,max_index)

    chunks.append(indices)

return chunks
And here is a picture of the resulting graph, the dashed lines indicate which areas the lorentzians are fit in: Lorentzian Fitting Plot
answered Mar 17 '26 06:03
If you love us? You can donate to us via Paypal or buy me a coffee so we can maintain and grow! Thank you!
Donate Us With